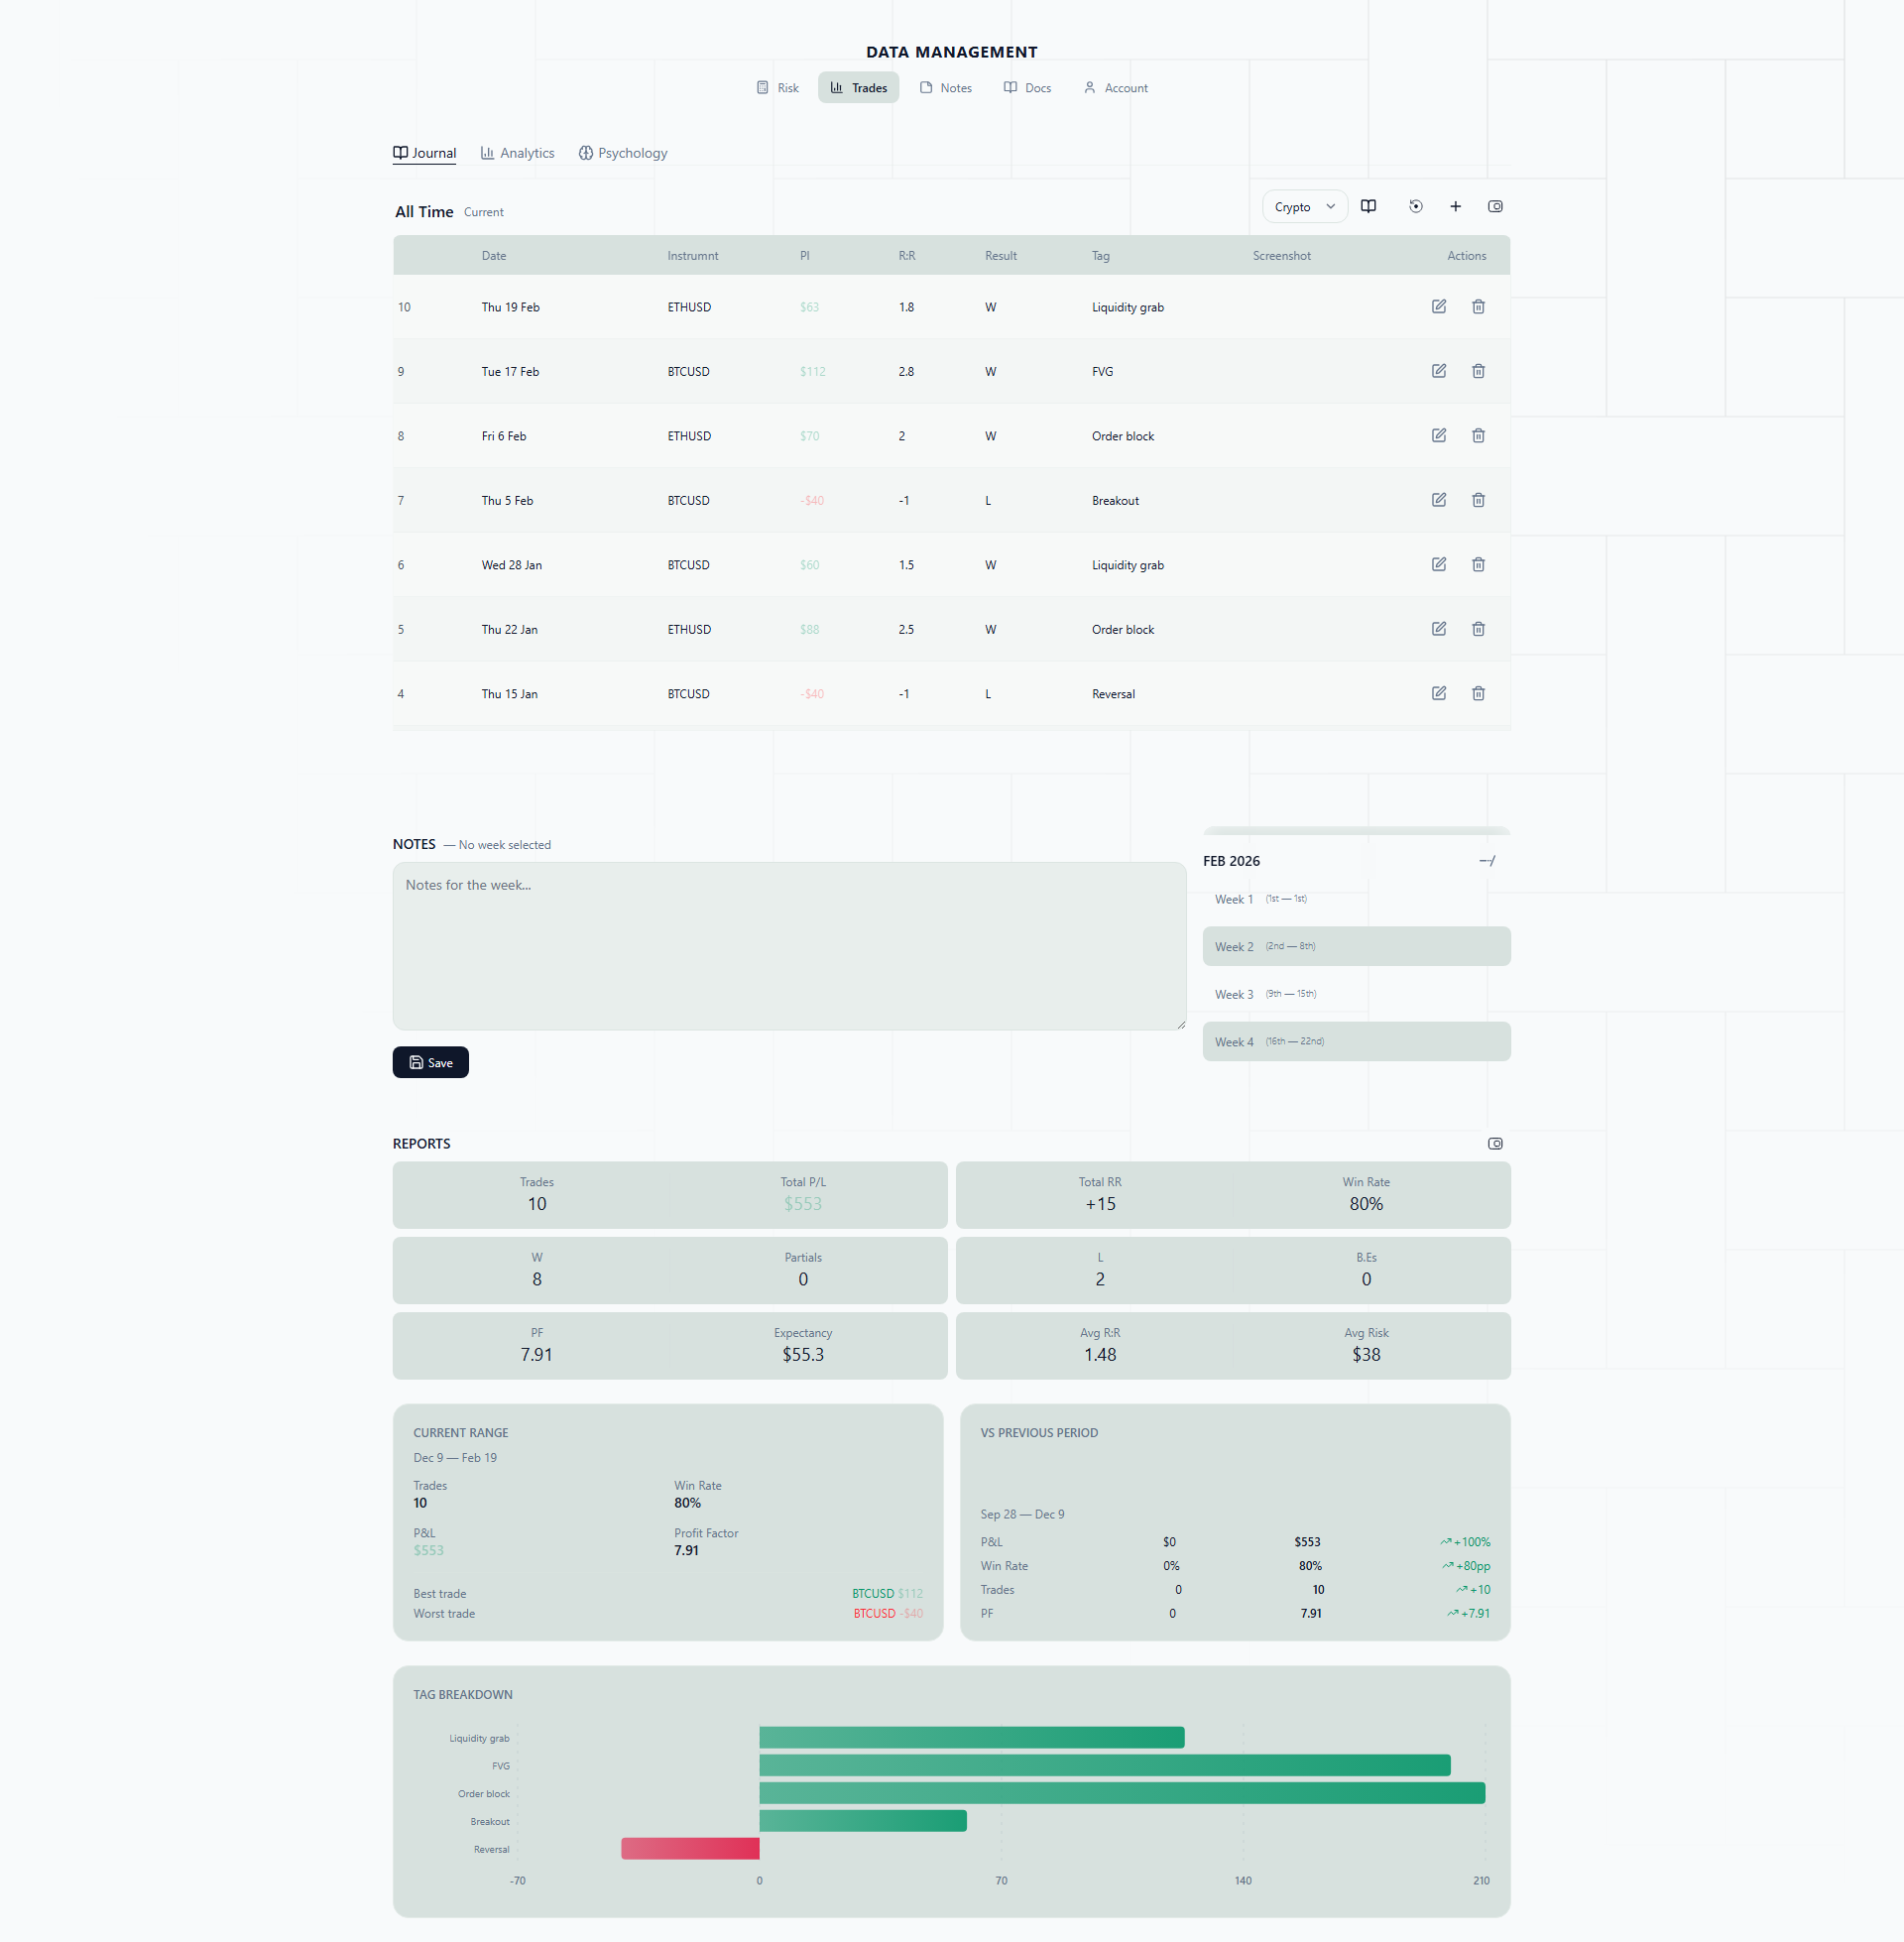
Automated Trading Journal
Every closed trade is automatically journaled. Import past data from any platform, optimize your edge with advanced filtering, and discover what makes you win consistently.
See every trading day at a glance.
Daily P&L rendered as a color-coded heatmap. Spot winning streaks, losing runs, and tilt periods instantly. Click any day to drill into individual trades.
- Color-coded daily P&L — green for profit, red for loss
- Monthly and yearly aggregations
- Click any day to see all trades for that session
- Streak tracking — consecutive wins, losses, and break-even days
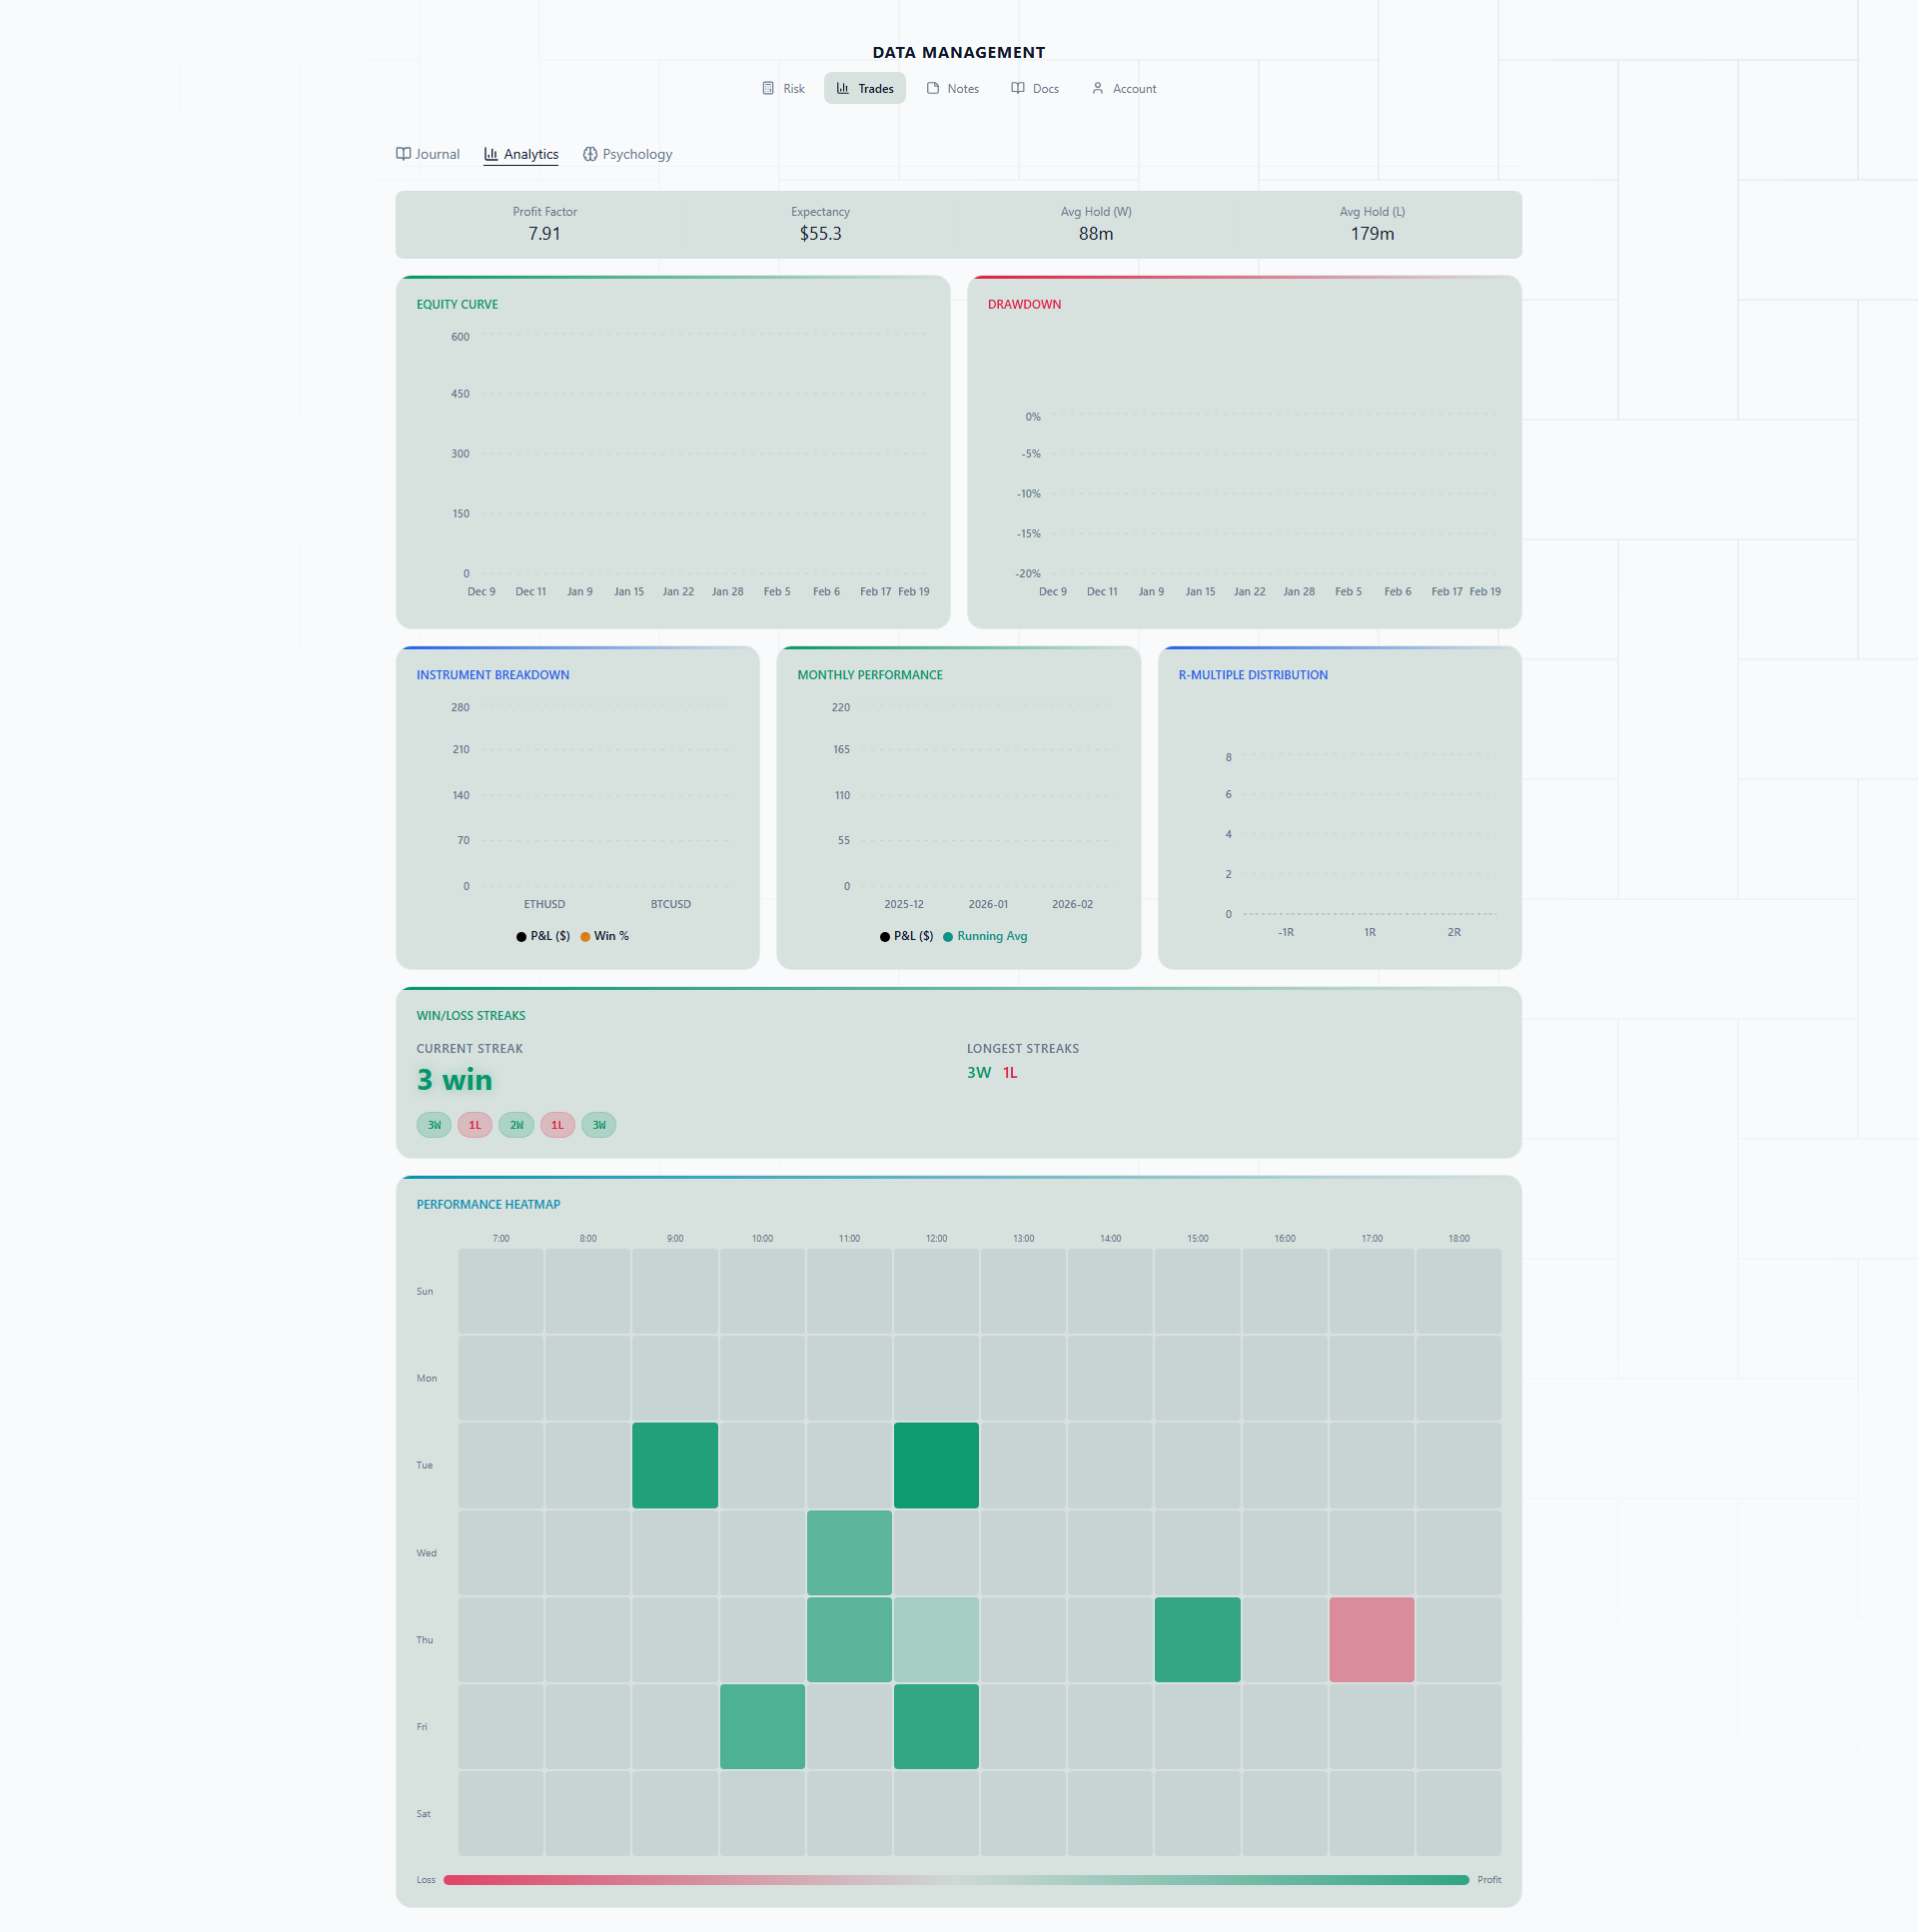
Performance analytics that update in real-time.
Smart analysis that reveals your edge. Filter by date range, symbol, tag, or strategy. Bounce data from different journals off each other. All your data working for you.
- Equity curve and drawdown visualization
- Win rate, profit factor, expectancy, and Sharpe ratio
- Breakdown by symbol, session, day of week, and setup type
- Filter and search across your entire trade history
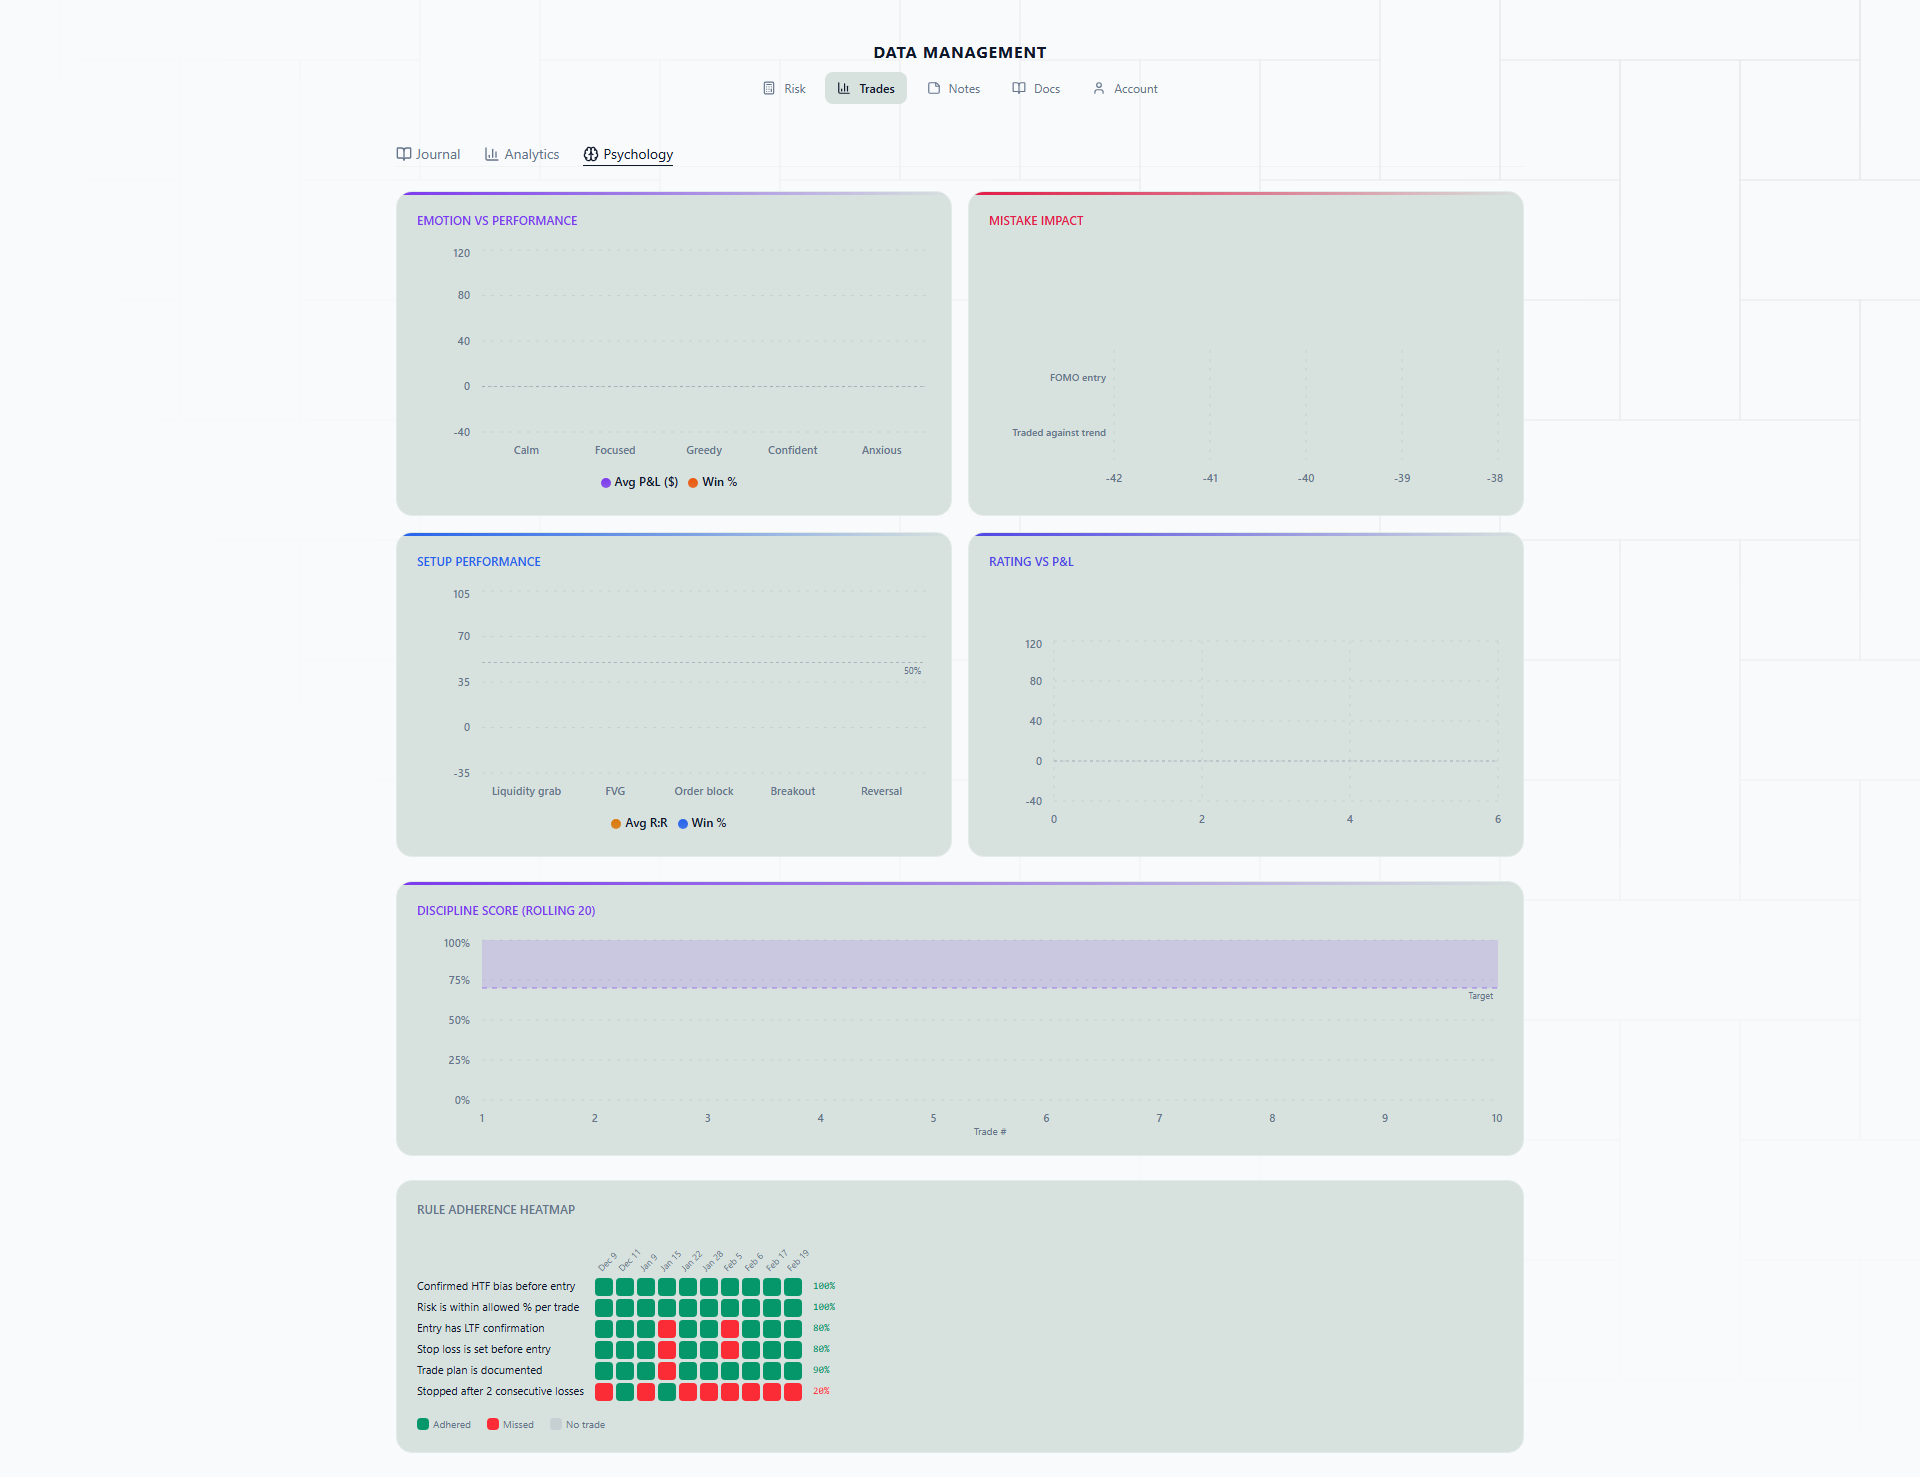
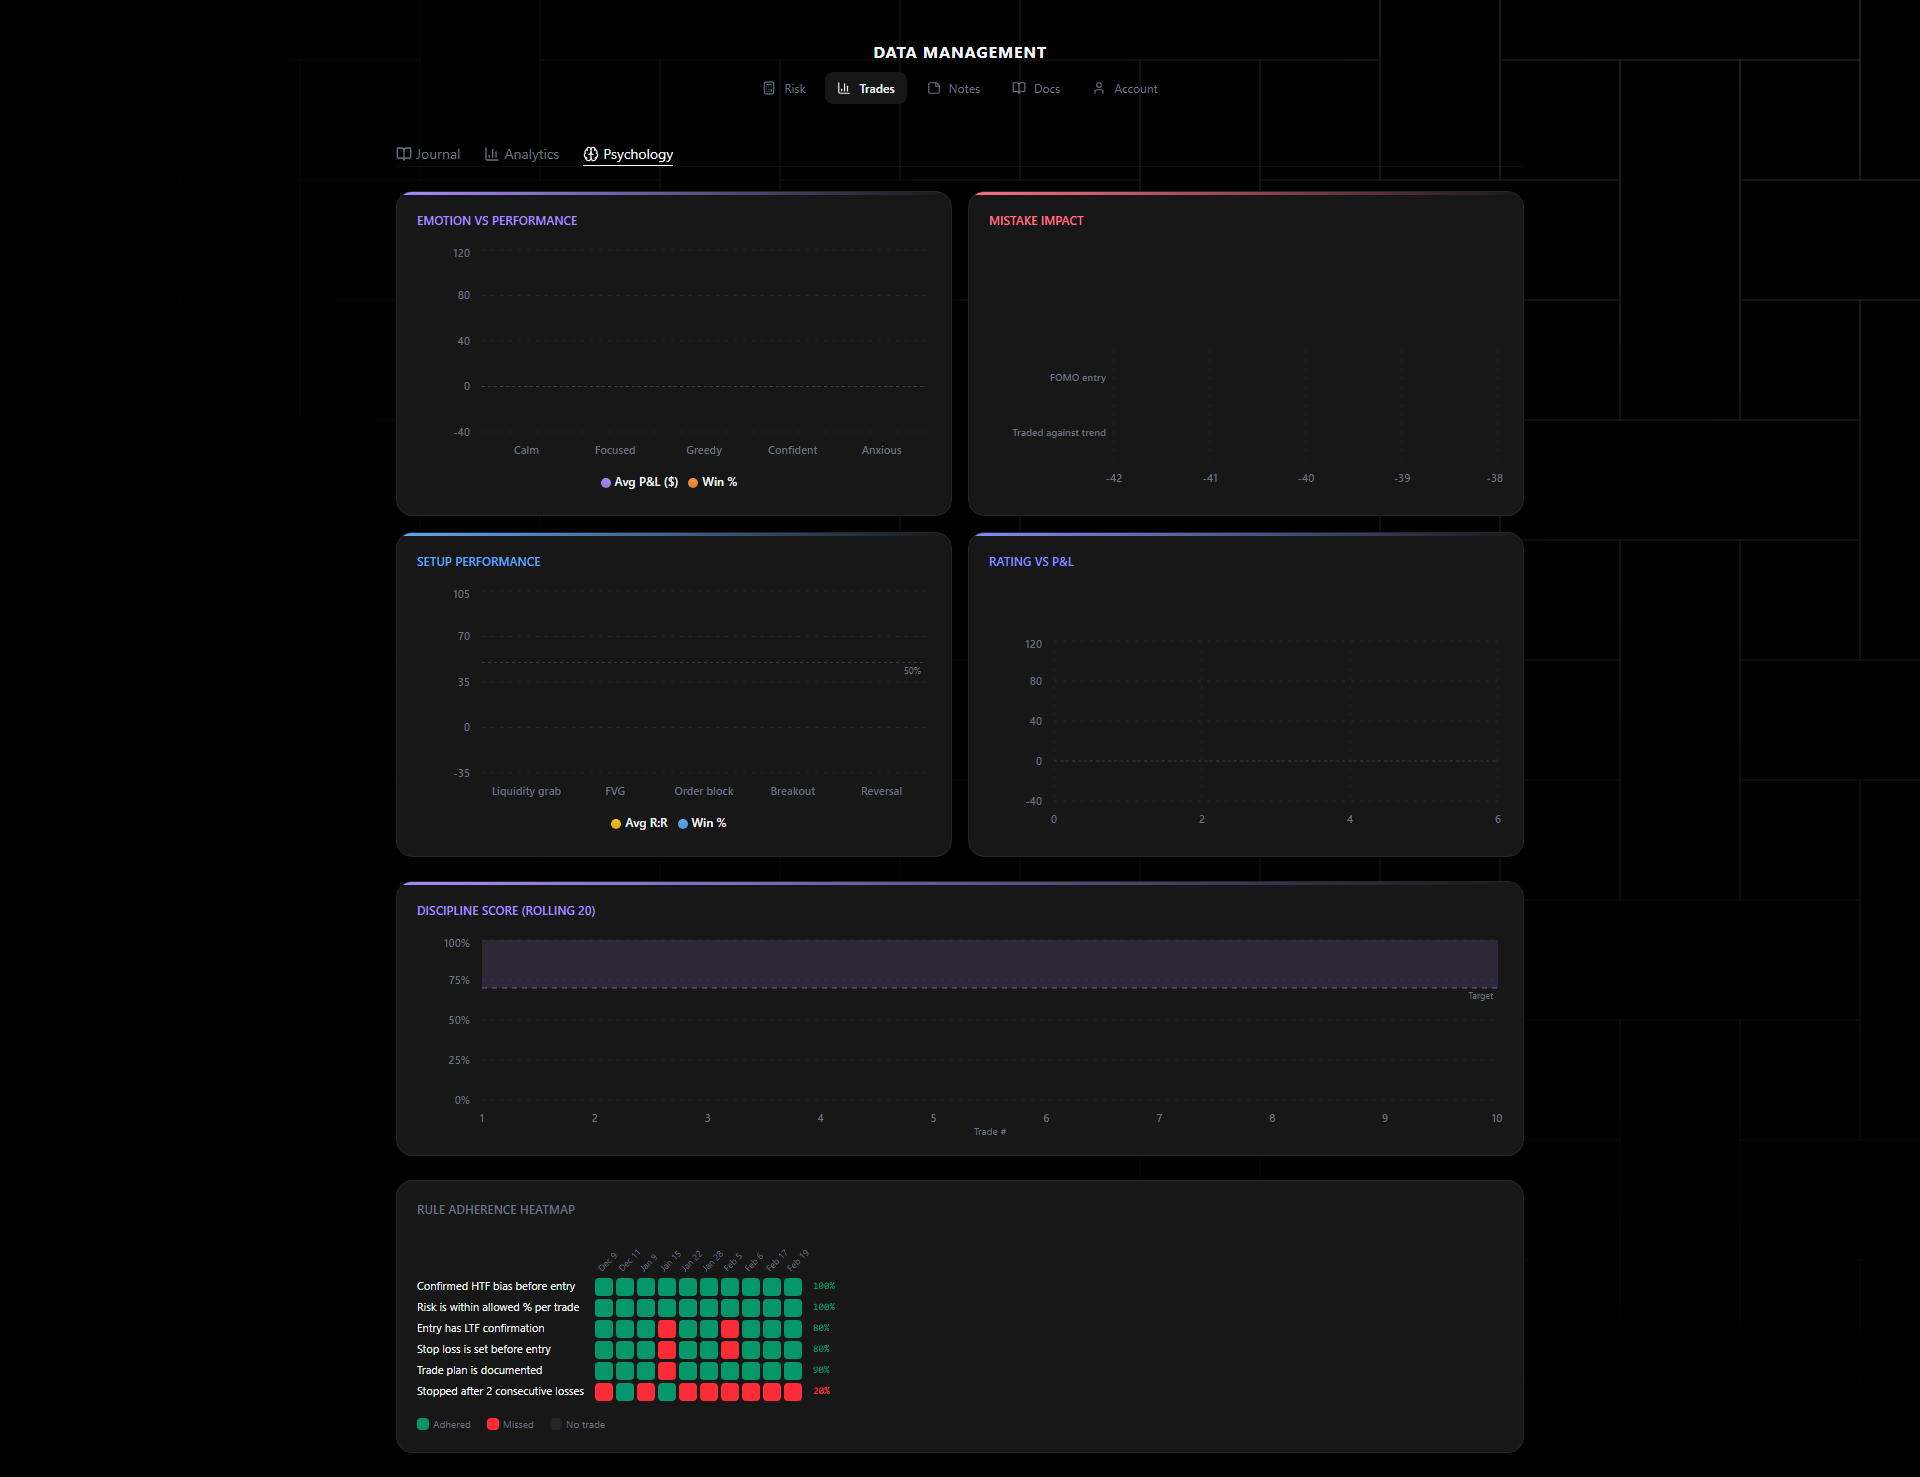
Track emotions. Find the patterns.
Deep insights into your subconscious trading patterns, fears, and what makes you truly special as a trader — that even you don't know yet. Correlate psychology with performance over time.
- Pre-trade and post-trade emotion logging
- Confidence, discipline, and tilt tracking
- Correlate emotional patterns with P&L outcomes
- Custom tags for setup quality and trade management
Auto
Trade data capture
100%
Trades captured
4
View modes
Free
To start
Your trades are waiting.
Start discovering.
Every closed trade, automatically journaled. Calendar heatmap, analytics, psychology tracking — free to start.