Growth & Costs
Two tabs for forward planning and cost awareness. Growth helps you project where your account is headed. Costs help you understand what is silently eating into your profits along the way.
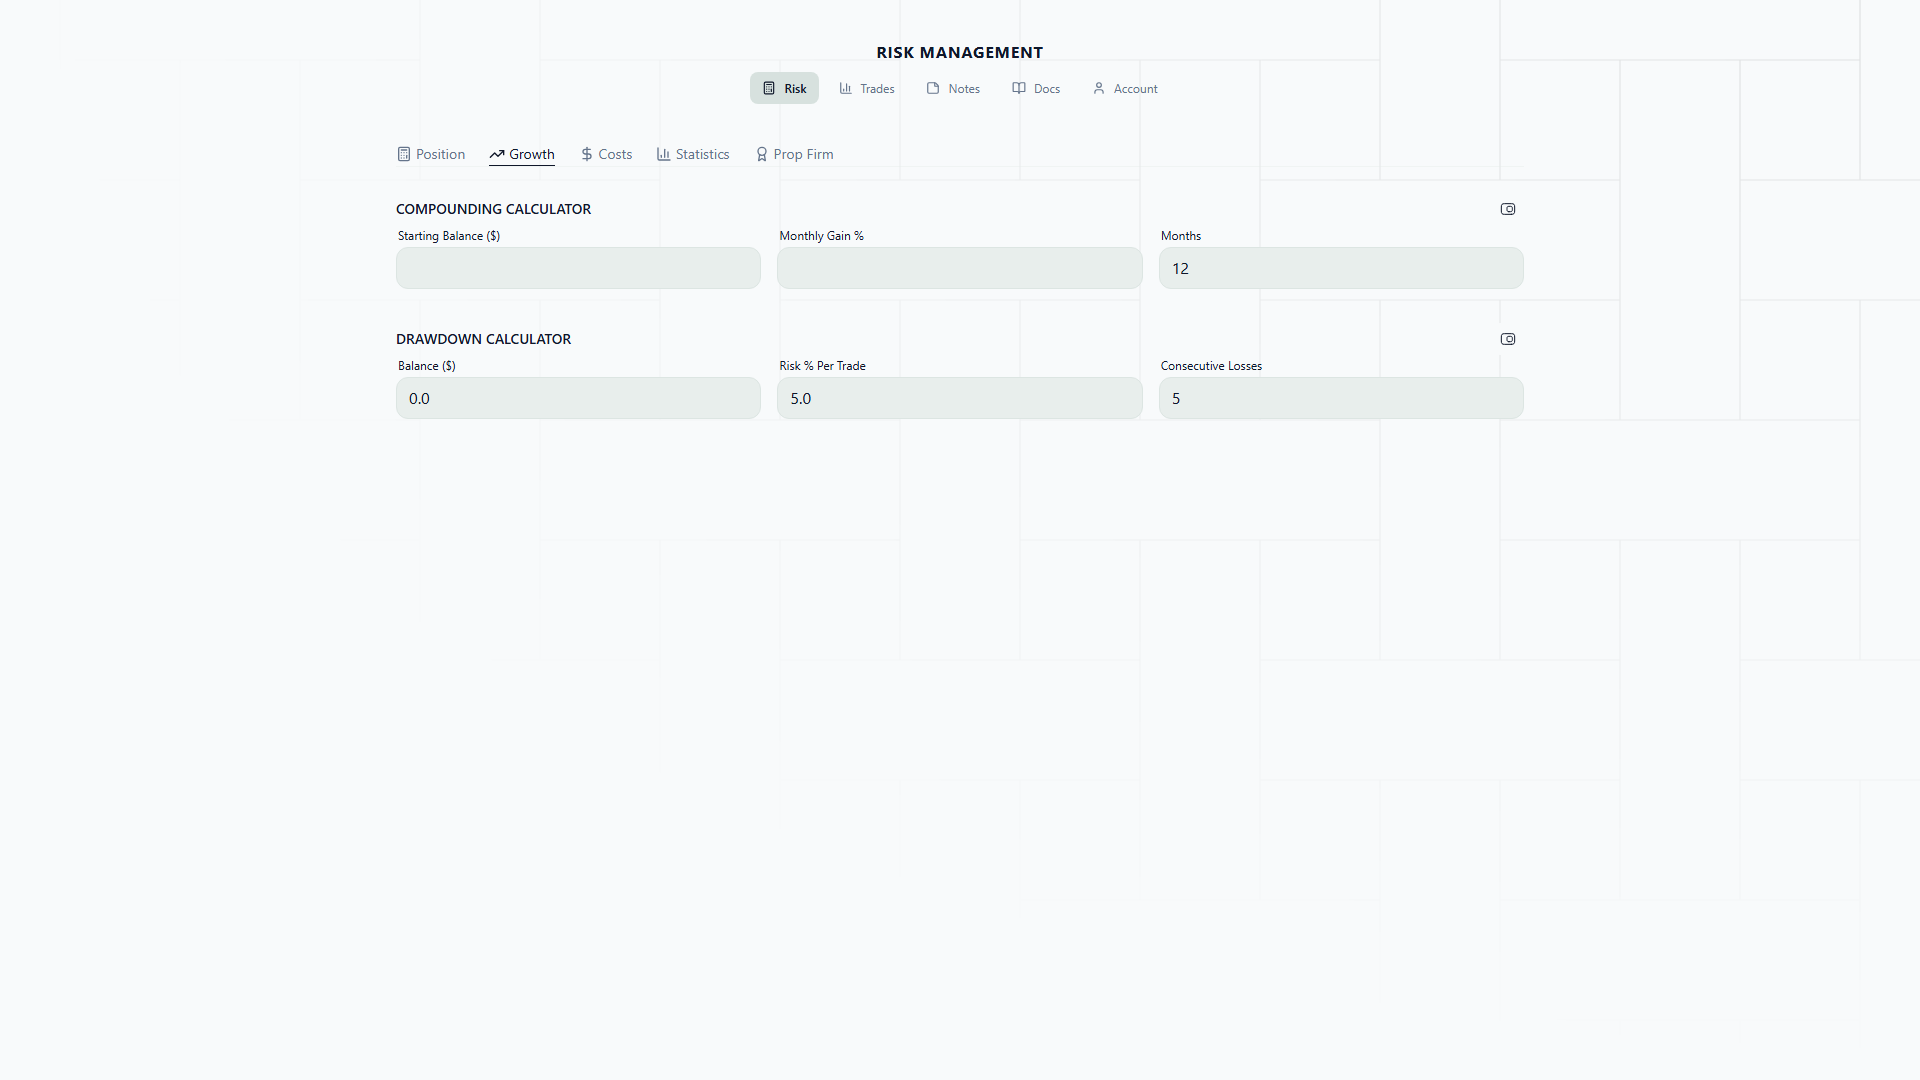
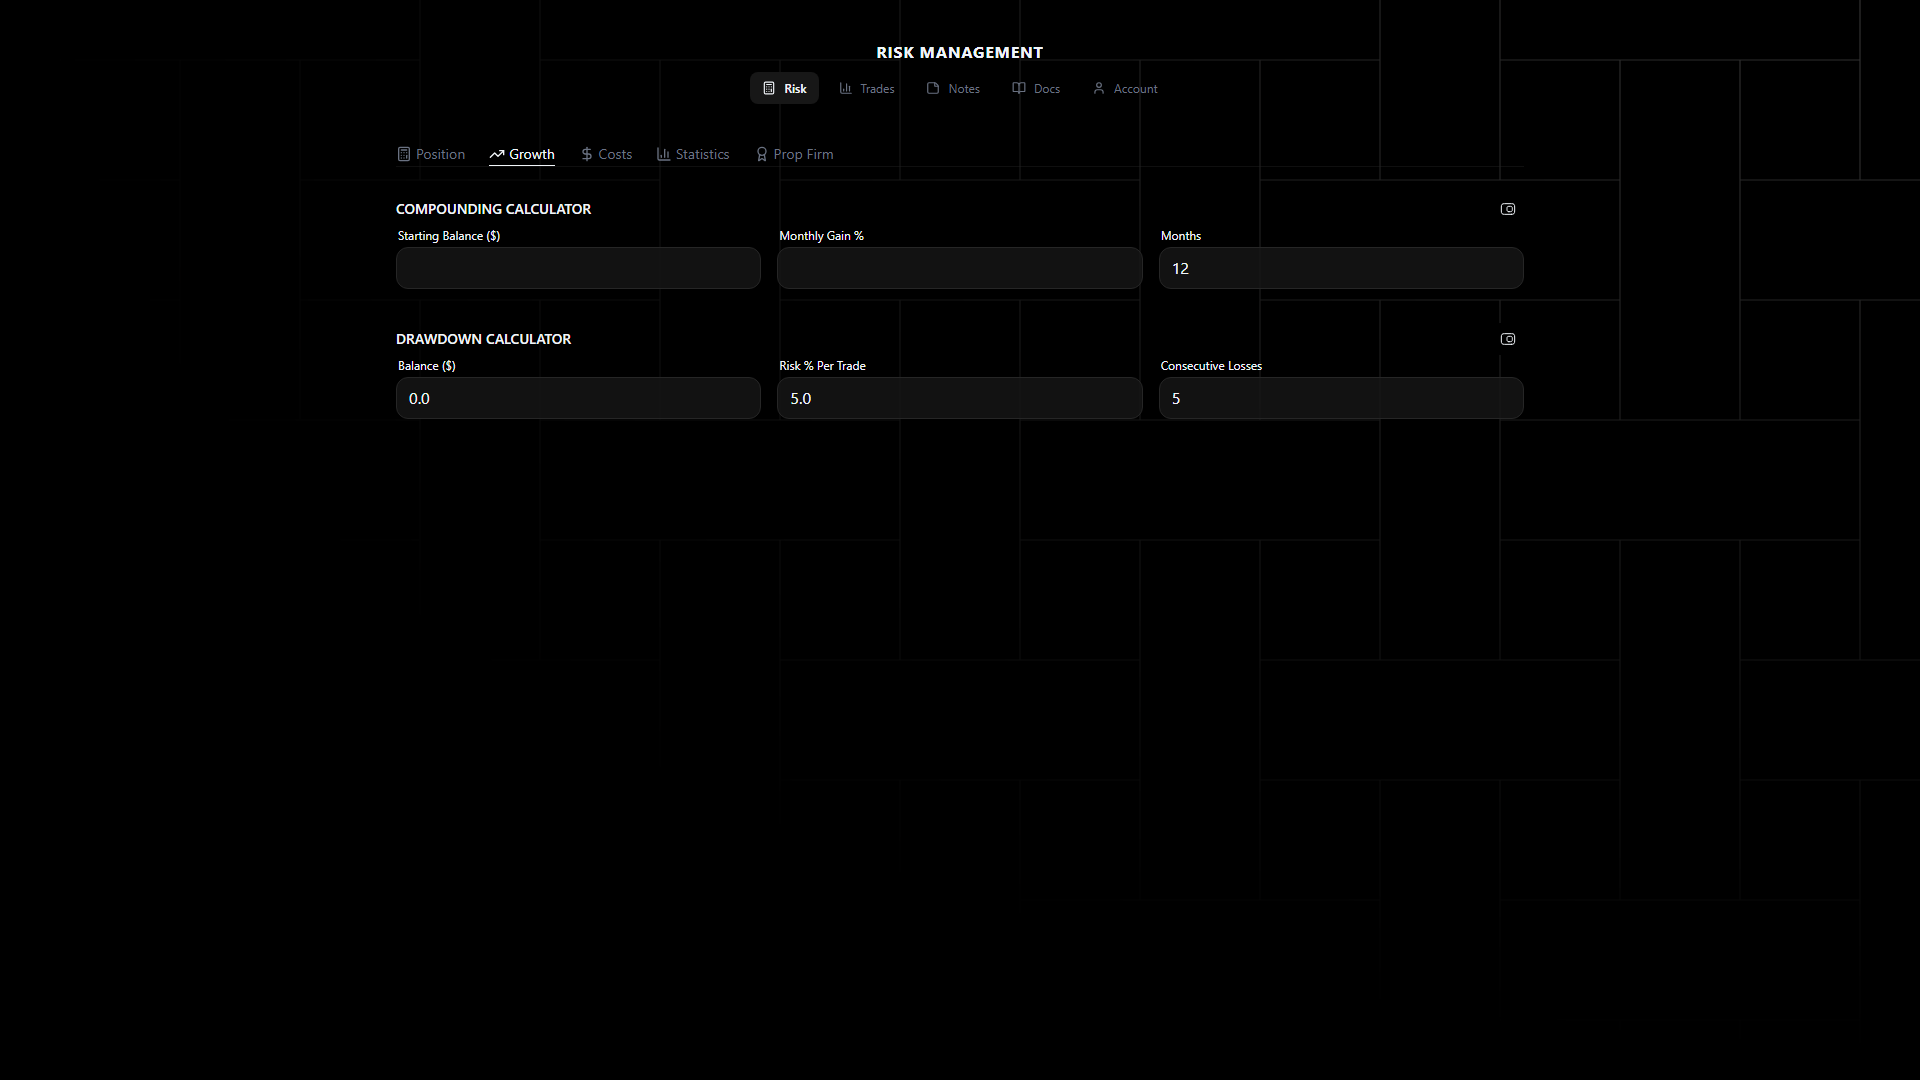
Growth Tab Screenshot
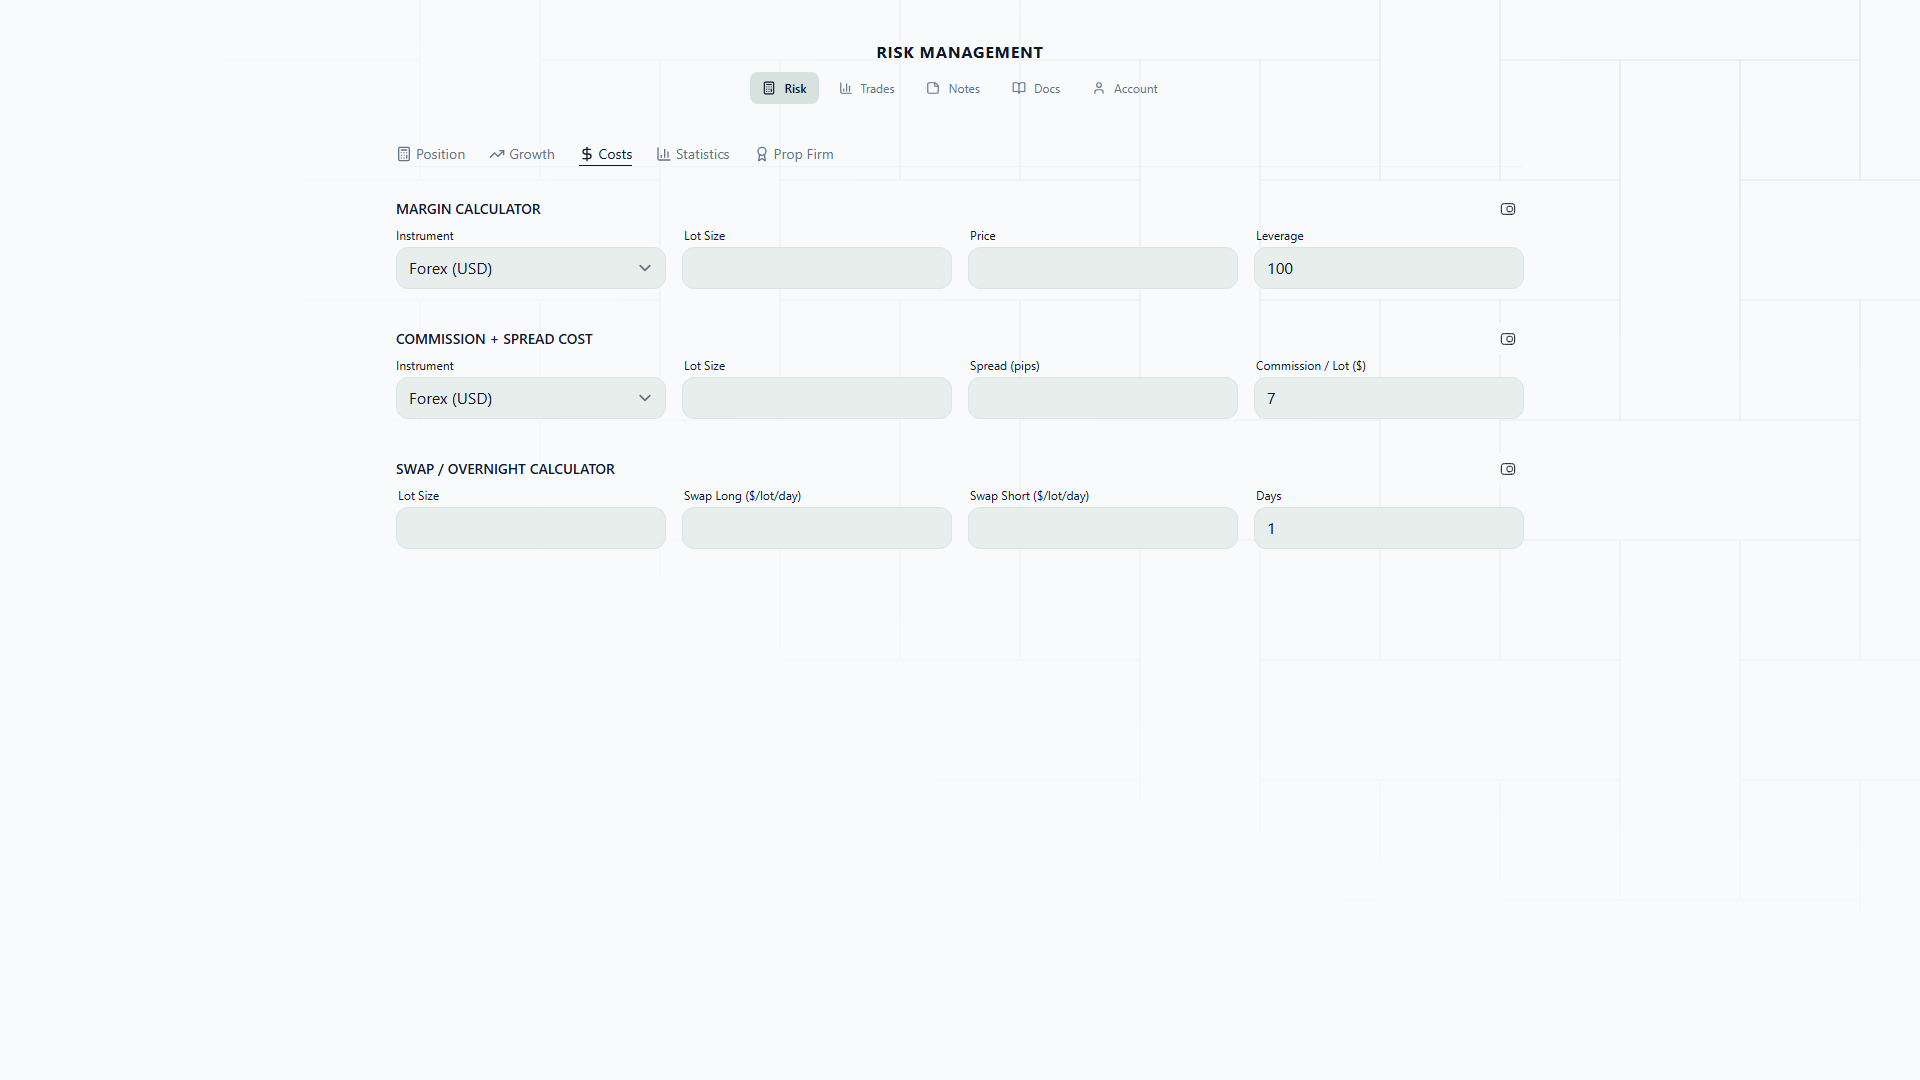
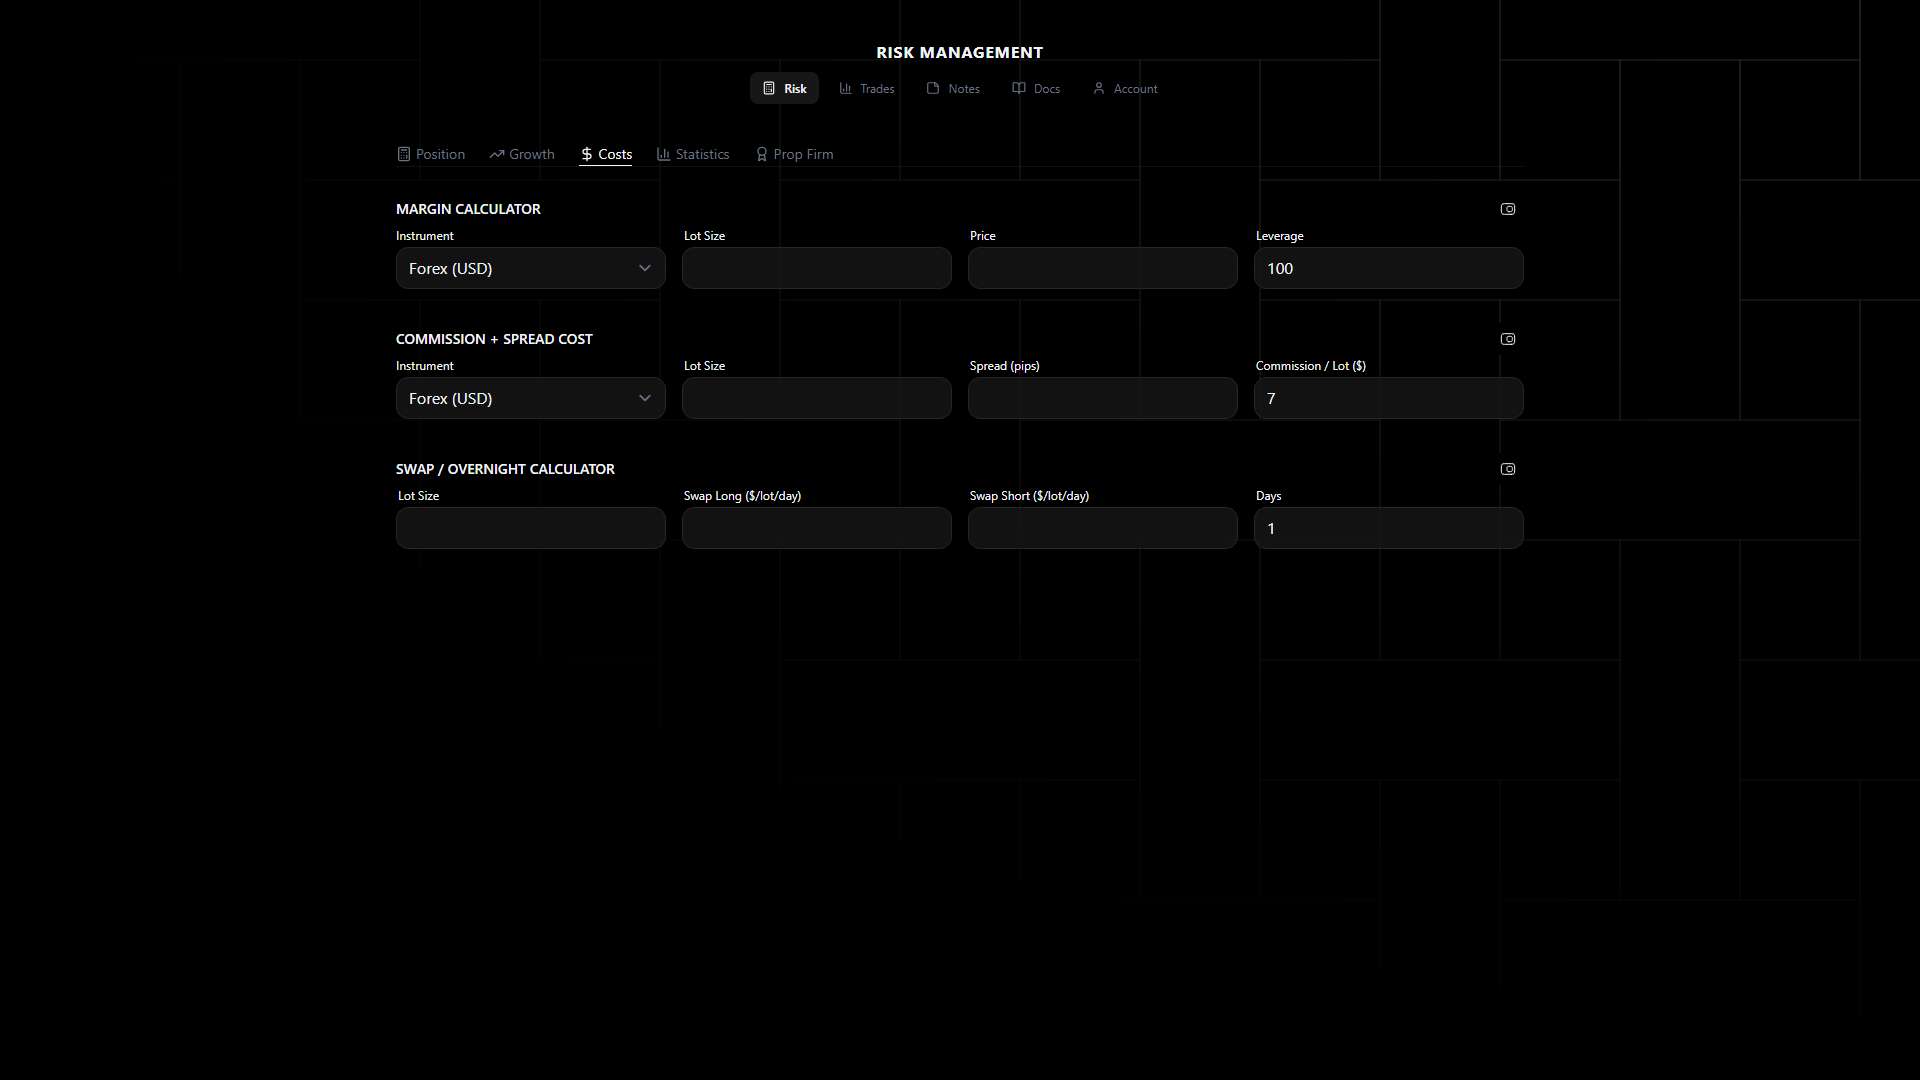
Costs Tab Screenshot
Growth Tab
Compounding Projections
Model your account growth over time:
- Starting Balance — Your account balance
- Monthly Return % — Expected average monthly return
- Months — Projection horizon
- Withdrawal % — Optional monthly withdrawal rate
The calculator shows a month-by-month table with projected balance, cumulative profit, and withdrawals.
Compounding Math Made Real
Numbers on a screen only click when you see them with your own account size. Here is a concrete example.
Scenario: $5,000 account, 5% average monthly return, 12 months
Without withdrawals and with compounding:
| Month | Balance | Monthly Profit |
|---|---|---|
| 1 | $5,250 | $250 |
| 3 | $5,788 | $276 |
| 6 | $6,700 | $319 |
| 9 | $7,757 | $369 |
| 12 | $8,979 | $428 |
Total profit after 12 months: $3,979 (79.6% growth).
Now compare that to adding profits without compounding — just putting $250/month aside and always trading on the original $5,000:
After 12 months: $5,000 + (12 x $250) = $8,000. That is $979 less than the compounding version.
The difference comes from profits earning profits. By month 12, your monthly return is $428 instead of the flat $250 you started with. That gap widens dramatically over longer timeframes.
Now add a 20% monthly withdrawal:
With compounding and 20% withdrawal each month:
| Month | Balance | Withdrawal |
|---|---|---|
| 1 | $5,200 | $50 |
| 6 | $5,890 | $57 |
| 12 | $6,680 | $65 |
After 12 months, your account has grown to $6,680 and you have withdrawn a cumulative ~$680. Total value created is $2,360 — less than the no-withdrawal scenario, but you have been paying yourself along the way.
The Growth tab lets you model these scenarios instantly. Try different return rates, different withdrawal percentages, and different time horizons to set realistic expectations for your trading plan.
Drawdown Analysis
Understand your drawdown exposure:
- Max Drawdown % — Your worst historical or expected drawdown
- Recovery Trades — How many winning trades needed to recover from various drawdown levels
- Drawdown Table — Shows balance at each drawdown percentage (5%, 10%, 15%… up to 50%)
Drawdown Recovery Reality Check
Drawdowns are not symmetrical. This is one of the most important concepts in risk management, and it trips up even experienced traders.
Here is why:
| Drawdown | Balance (from $10,000) | Gain Needed to Recover |
|---|---|---|
| 10% | $9,000 | 11.1% |
| 20% | $8,000 | 25.0% |
| 30% | $7,000 | 42.9% |
| 40% | $6,000 | 66.7% |
| 50% | $5,000 | 100.0% |
A 50% drawdown requires a 100% gain just to get back to where you started. That is not a typo. If your $10,000 account drops to $5,000, you need to double it to recover. Depending on your strategy and average monthly return, that could take 6-12 months of profitable trading.
This is why drawdown prevention is more important than profit maximization. The math of recovery is brutal, and it gets exponentially worse as the drawdown deepens. A 10% drawdown is a minor setback — an 11% gain recovers it. A 30% drawdown is a serious wound that needs a 43% gain to heal.
The Drawdown Analysis section makes this visible. When you see your current balance at each drawdown level and the number of winning trades needed to recover, it changes how you think about risk. That next trade where you were considering bumping risk to 5% “just this once” looks different when you can see that three losses at 5% puts you in a 14% hole requiring a 16% gain to climb out.
Costs Tab
The Hidden Cost Problem
Most traders track their wins and losses but ignore the costs sitting between them. Commissions, swap, and spread are always working against you — every single trade, whether it wins or loses. Over time, these costs compound into a meaningful drag on performance.
Here is a real scenario that illustrates the problem:
A trader takes 40 trades per month on EURUSD at 0.5 lots. Their broker charges $7 per lot round-trip.
- Commission per trade: 0.5 lots x $7 = $3.50
- Monthly commission: 40 trades x $3.50 = $140/month
- Yearly commission: $1,680
That is $1,680 per year on a single pair. Now add a second pair — say they also trade GBPJPY 20 times per month at 0.3 lots:
- Additional monthly commission: 20 x 0.3 x $7 = $42/month = $504/year
Total annual commission: $2,184. On a $10,000 account, that is 21.8% of the starting balance consumed by commissions alone. If the trader’s gross return is 40% per year, nearly half of it goes to commissions.
This is why the Costs tab exists. It makes these numbers visible before they surprise you at year-end.
Margin Calculator
Calculate the margin required for a position:
- Instrument — Trading instrument
- Lot Size — Position size
- Leverage — Account leverage
- Price — Current market price
Output: required margin in your base currency.
Commission Estimator
Estimate round-trip commission costs:
- Commission per Lot — Your broker’s commission rate
- Lot Size — Position size
- Trades per Month — Expected trade frequency
Output: per-trade cost, monthly cost, yearly cost.
Swap Tracker
Estimate overnight holding costs:
- Swap Long/Short — Daily swap rates
- Lot Size — Position size
- Holding Days — Expected hold duration
Output: total swap cost for the holding period.
The Swap Surprise: A Weekend Lesson
Swap rates catch traders off guard, especially with the triple-swap day. Most brokers charge three days of swap on Wednesday night (to account for the weekend settlement). If you are holding a position through Wednesday’s close, you pay Friday + Saturday + Sunday swap in a single hit.
Here is a scenario that makes this concrete:
You are short 0.5 lots of GBPJPY. The daily short swap is -$8.50 per lot.
- Normal day: 0.5 x -$8.50 = -$4.25
- Wednesday (triple swap): 0.5 x -$8.50 x 3 = -$12.75
If you hold this position for 7 days, your total swap cost is:
- 4 normal days: 4 x $4.25 = $17.00
- 1 triple swap day: $12.75
- Total: $29.75
That might not sound like much, but consider a swing trader holding GBPJPY short for three weeks (21 days, with 3 triple-swap Wednesdays): the swap cost reaches $89.25. If the trade’s profit target was $150, swap alone consumed 59.5% of the gain.
The Swap Tracker shows you this cost upfront. Before entering a swing trade, plug in the swap rates and your expected hold duration. If the swap cost is a significant percentage of your target profit, you might reconsider the direction (some pairs have positive swap on one side) or the hold duration.
How to Use the Costs Tab
A practical workflow for cost-aware trading:
-
Before each month, enter your expected trade count and average lot size into the Commission Estimator. This gives you a “cost budget” for the month. If your target profit is $500 and your estimated commissions are $180, you know you actually need $680 in gross profits to hit your goal.
-
Before swing trades, check the Swap Tracker. Anything held overnight costs money (or occasionally earns it, if you are on the positive swap side). If you are holding over a weekend, triple your Wednesday estimate.
-
Before large positions, check the Margin Calculator. On high-leverage accounts this rarely matters, but on accounts with 1:30 leverage (common in EU-regulated brokers), a 1-lot XAUUSD position at $2,300 requires significant margin. You want to know this before you enter, not when your broker rejects the order.
-
Quarterly, add up your actual commission and swap costs and compare them to your gross P&L. If costs are eating more than 15-20% of your gross profits, consider reducing trade frequency, switching to a lower-commission broker, or adjusting position sizes.