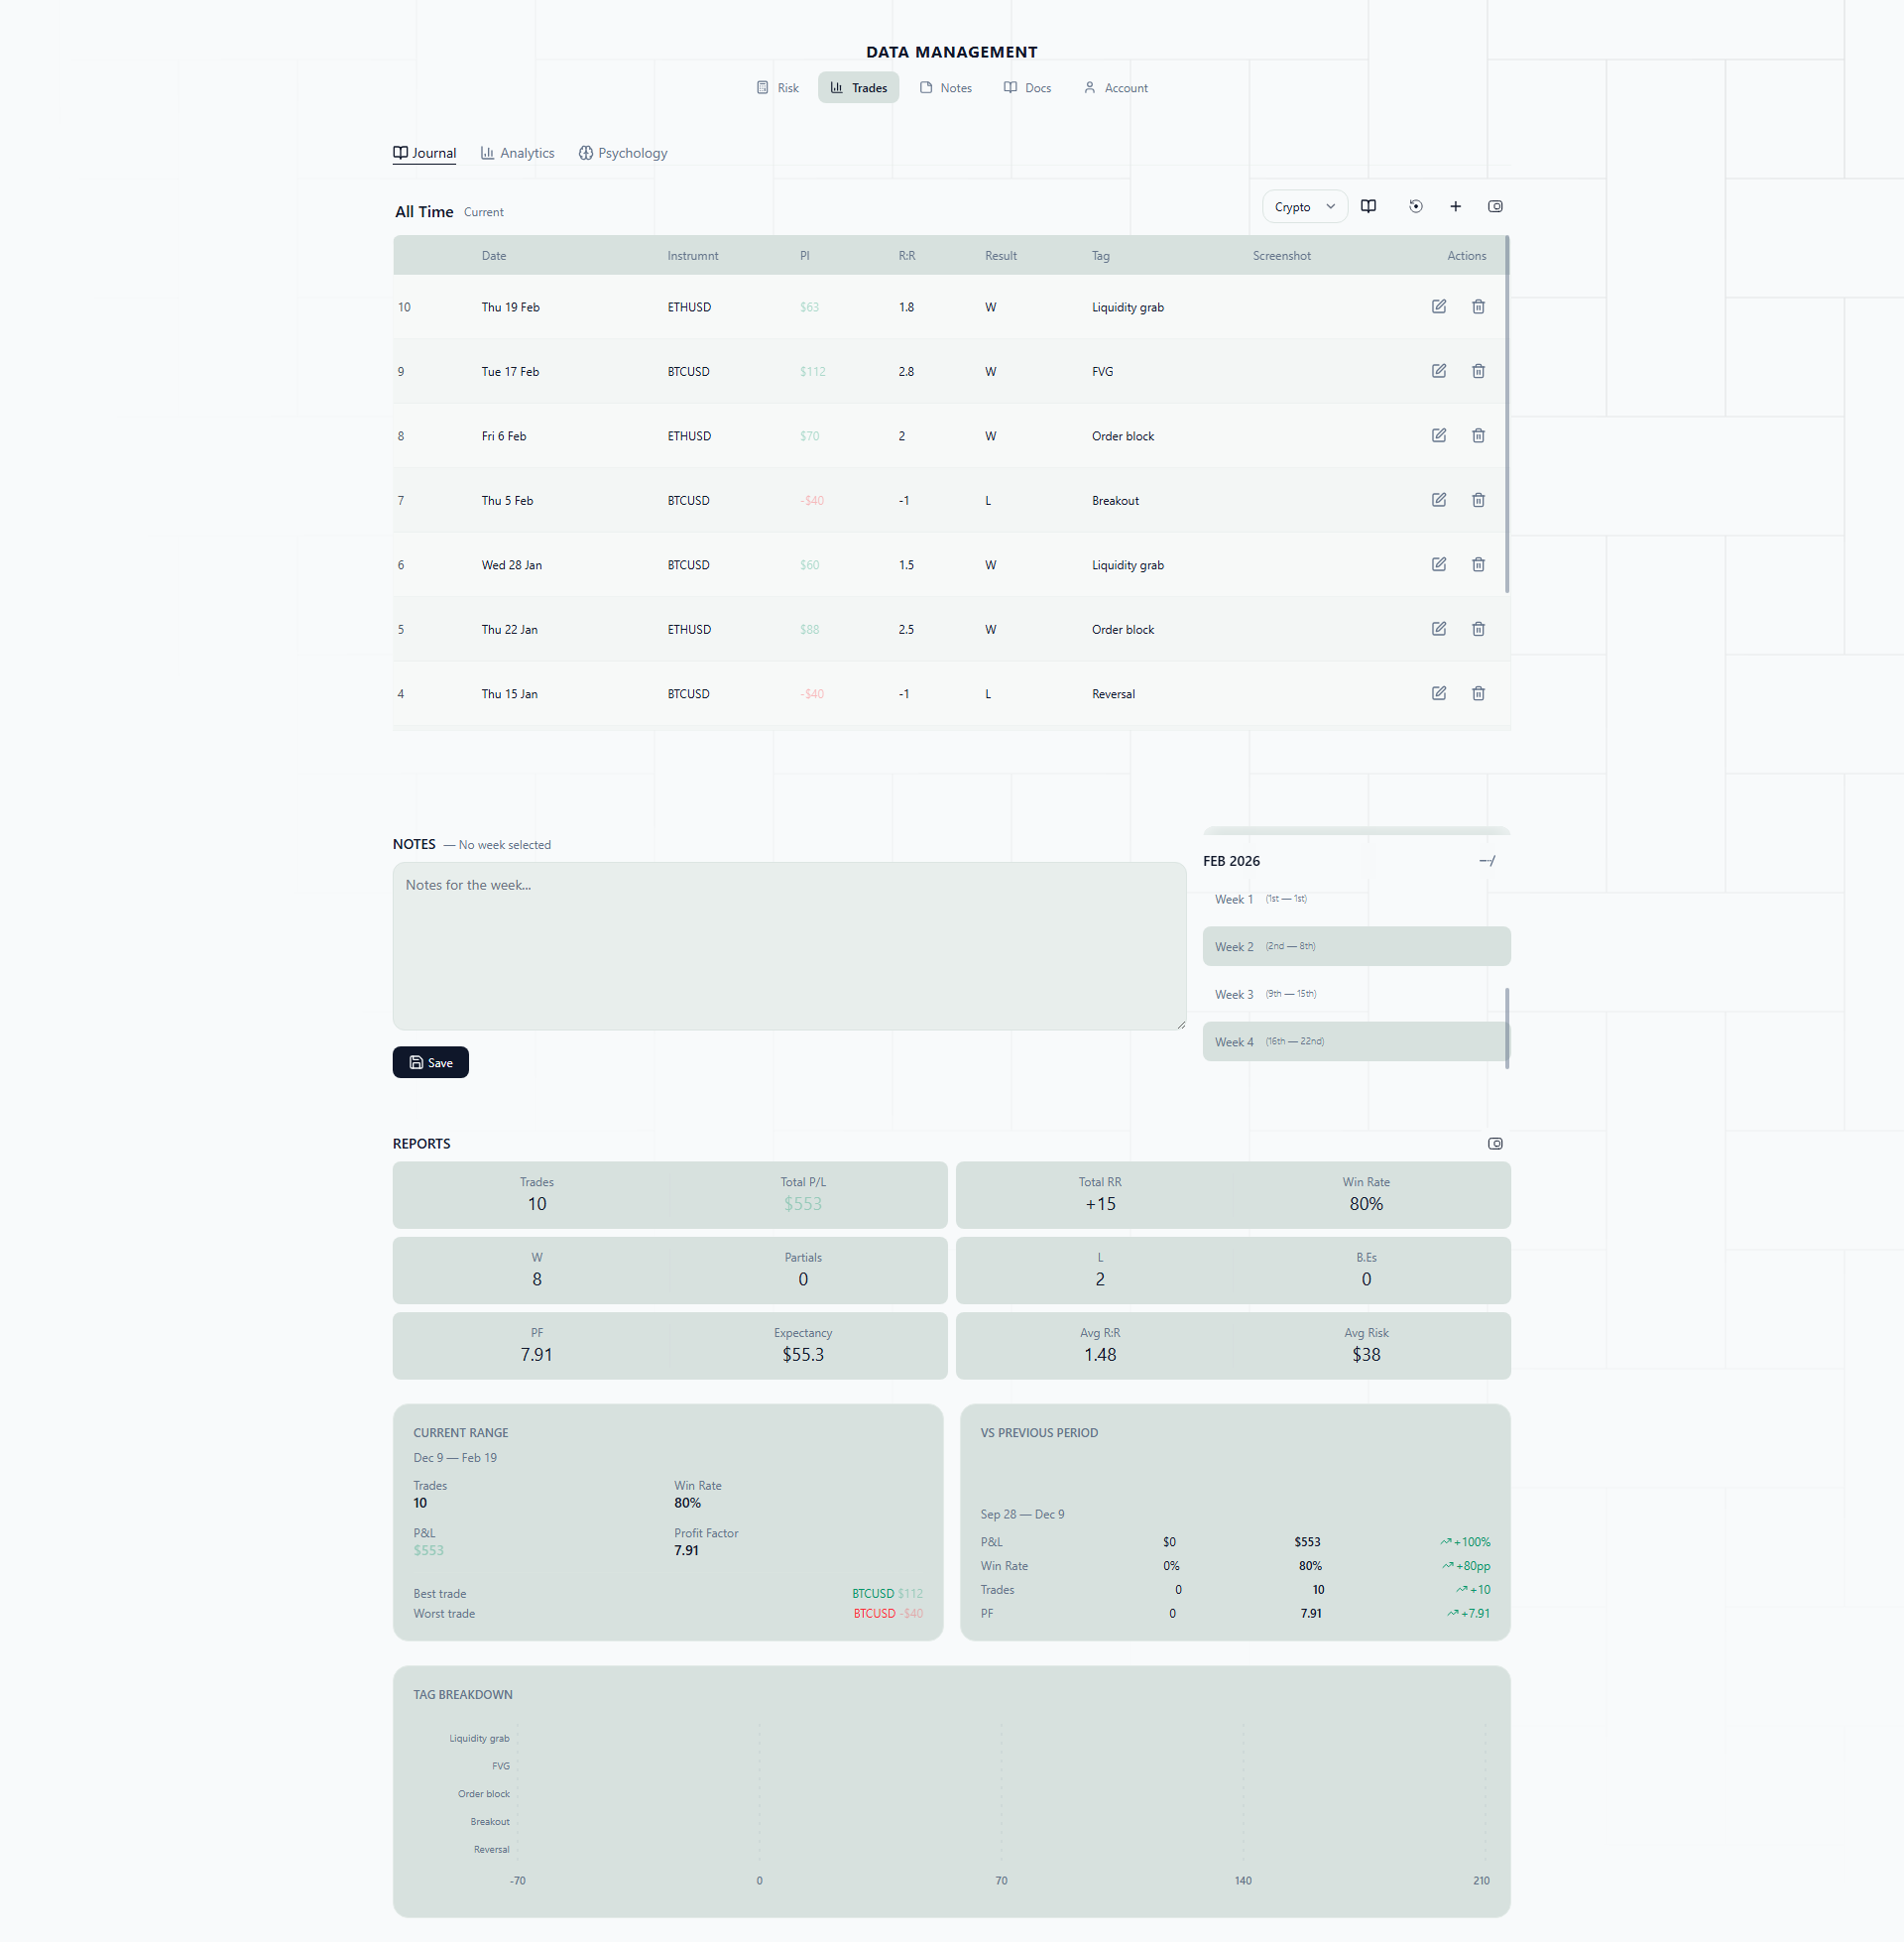
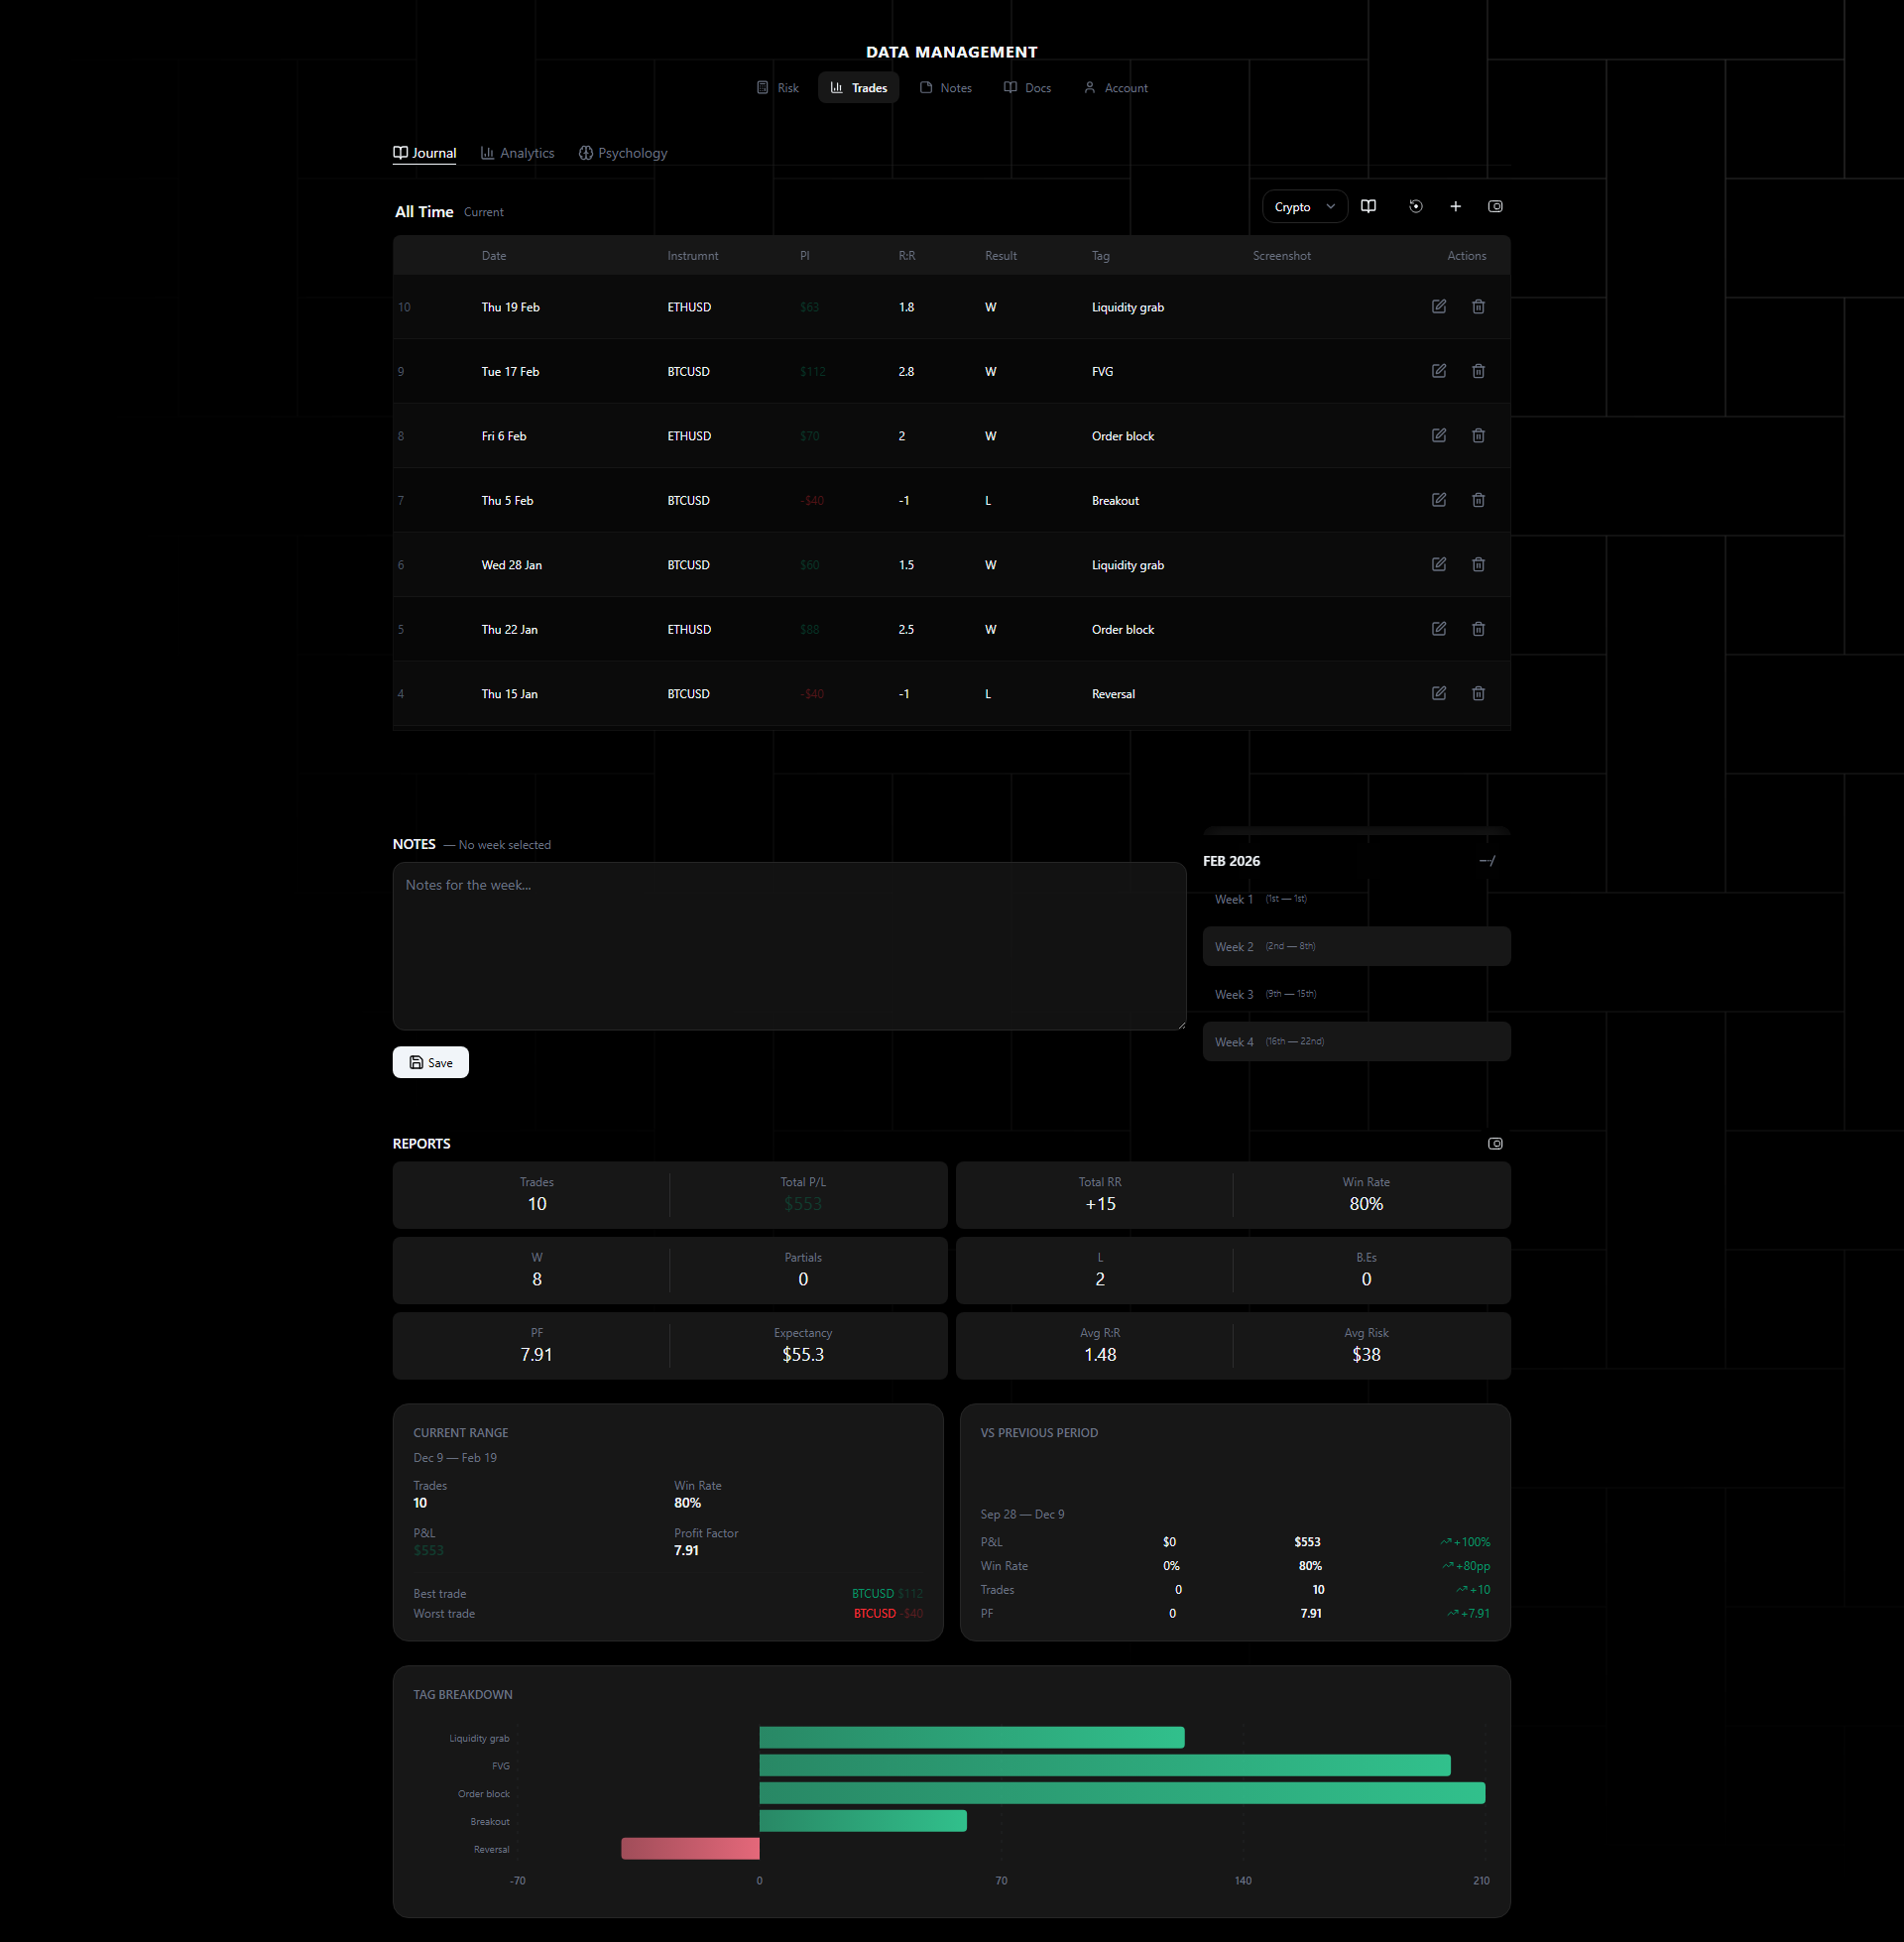
Table View
The table view displays all trades in a sortable, scrollable table with key metrics visible at a glance.
When to Use Table View
The calendar view is great for patterns over time. The table view is for when you need precision — exact numbers, side-by-side comparison of specific trades, and the ability to sort and slice your data in different ways.
Use the table view when you want to:
- Find your best and worst trades — Sort by P&L and immediately see the extremes. What did they have in common? Were your biggest winners all on the same instrument? Were your worst losers all taken during news events?
- Compare trades on a specific instrument — Filter down to XAUUSD or NAS100 and see your full history on that pair. Your win rate on EURUSD might be 62%, but you might be only 35% on GBPJPY — the table makes this obvious.
- Drill into individual trade details — Click any row to see the full breakdown including psychology fields, screenshots, and timestamps.
- Export or review data chronologically — Sort by date to walk through your trading history in order, trade by trade.
Think of the calendar as your “big picture” view and the table as your “microscope.”
Real-Life Scenarios
Sorting by P&L to find what your best trades have in common. You sort the table by P&L descending. Your top five trades are: XAUUSD +$420, NAS100 +$380, XAUUSD +$310, EURUSD +$285, XAUUSD +$270. Three out of five are gold trades. You click into each one and notice they were all taken during the London session, all used a liquidity sweep setup, and all had an initial risk-reward of at least 1:3. Now you know exactly what your edge looks like — and you can deliberately take more trades that match this profile.
Discovering which instruments are costing you money. You sort by instrument and scroll through your GBPJPY trades. Out of 14 trades, only 4 were winners. Your net P&L on GBPJPY is -$630 while every other pair you trade is profitable. You have been bleeding money on this pair for weeks without realizing it because the losses were spread across different days and never stood out in the calendar. The table view groups them together and makes the pattern undeniable. You drop GBPJPY from your watchlist.
Using the detail panel for a trade review. You click into a losing EURUSD trade from last Tuesday. The detail panel shows you entered at 1.0845 with a stop at 1.0820, targeting 1.0905. Your risk-reward was 1:2.4 — solid. But the psychology fields tell a different story: emotion tagged as “Revenge,” mistake tagged as “Early Entry.” You look at the screenshot you attached and see that you entered before the pullback completed. The setup was right, but your execution was emotional. That is a very different problem than having a bad strategy, and it requires a very different fix.
Columns
Default visible columns:
- Date and time (close date)
- Instrument
- Direction (Buy/Sell with color coding)
- Entry price
- Close price
- Stop loss / Take profit
- Lot size
- Result (Win/Loss/BE)
- P&L (dollar amount, color-coded)
- Risk-Reward ratio
Sorting
Click any column header to sort ascending or descending. The active sort column is highlighted.
Common Sorting Workflows
Here are some practical ways to use sorting to extract insights from your trade data:
Sort by Risk-Reward (descending) to find trades where you captured large moves. Compare these to your average RR — if your best trades regularly hit 3R or 4R but your average is 1.2R, you might be cutting winners too early on most trades. The outliers show you what is possible when you let trades run.
Sort by Risk-Reward (ascending) to find the opposite — trades where you barely eked out a win or took a tiny loss relative to your risk. If you see a cluster of 0.3R and 0.5R winners, it might mean you are taking profit too early or your targets are too tight.
Sort by P&L (ascending) to face your worst trades directly. These are the ones that hurt your account the most. Click into each one and look for commonalities: same instrument? Same time of day? Same emotional state? Your biggest losses almost always share a pattern.
Sort by date for chronological review. This is useful during your weekly or monthly review when you want to walk through your trades in order and reconstruct what your trading week actually looked like.
Sort by instrument to evaluate your per-instrument performance. If you trade five different pairs, sort by instrument and mentally group them. Which instruments are contributing to your equity and which are dragging it down?
Trade Details
Click any row to open the full trade detail panel showing:
- All price levels (entry, SL, TP, close)
- Volume and direction
- Result and P&L
- Risk-reward ratio
- Swap and commission
- Open and close timestamps
- Psychology fields (emotion, mistakes, setup, notes) if populated
- Attached screenshots
Navigate between trades with previous/next controls without closing the detail panel. This is especially useful when you are reviewing a series of trades — you can step through them one by one without losing your place in the table.
Reports Summary
Above the table, a summary bar shows aggregate statistics:
- Total trades
- Win rate
- Average RR
- Profit factor
- Net P&L
- Best/worst trade
These numbers update dynamically based on any active filters, so if you filter down to a single instrument or date range, the summary reflects only those trades. This lets you compare your performance across different slices of your data without needing to export anything to a spreadsheet.
How to Use Table View for Reviews
Here is a practical approach for getting the most out of the table view:
- Start with the summary bar. Check your win rate, profit factor, and net P&L. These headline numbers tell you whether you are on track.
- Sort by P&L descending. Look at your top 3-5 winners. What do they have in common? Write down the pattern.
- Sort by P&L ascending. Look at your 3-5 worst losses. What do they have in common? Write down that pattern too.
- Click into any trade that surprises you. If a trade was a big winner but you do not remember it, click in and review the details. If a trade was a bigger loss than you thought, open it and check whether you followed your rules.
- Use the detail panel’s previous/next controls to step through trades sequentially when you want to review a specific day or week in detail.
The table view rewards curiosity. The more you sort, filter, and click into trades, the more patterns you will notice — and patterns are where trading improvement lives.