Prop Firm Tracker
Track your progress through prop firm evaluation phases. Available on Starter and PRO plans.
Why a Prop Firm Tracker?
Most traders who fail prop firm challenges don’t fail because of bad strategy. They fail because they breach a rule — usually the daily loss limit.
Think about how a typical challenge goes. You have a $100,000 account with an 8% profit target ($8,000), a 5% daily loss limit ($5,000), and a 10% max drawdown ($10,000). The profit target gets all the attention. Traders think about how to reach $108,000. But the account does not care about your profit target — it only ends when you breach a rule or the calendar runs out.
The daily loss limit is the killer. Here is why: on a normal trading day, you might take 2-3 trades. Each one risks 1% ($1,000). If all three lose, you are down $3,000 for the day — 3% of the account, 60% of your daily limit. One more losing trade and you are at 4%, dangerously close to the 5% breach. Without a tracker making that number visible, you might not realize how close you are until it is too late.
The tracker solves this by keeping your limits visible at all times. You always know exactly where you stand relative to your daily limit, your total drawdown limit, and your profit target. The color-coded alerts give you an unmistakable signal to stop trading before you do something irreversible.
Real-Life Scenario: The Wednesday That Almost Ended a Challenge
A trader is three weeks into an FTMO $100,000 Phase 1 challenge. Their stats so far:
- Current balance: $104,200 (+4.2% toward the 8% target)
- Max daily loss allowed: $5,000 (5% of starting balance)
- Max total drawdown: $10,000 (10% of starting balance)
Wednesday morning, they take two trades on GBPUSD and XAUUSD. Both stop out. Combined loss: -$2,100. Then a third trade on NAS100 stops out for -$1,000. The daily P&L is now -$3,100.
Without the tracker, the trader might think “I am having a bad day, but I am still up overall, I will take one more setup to recover.” That “one more” at 1% risk = $1,000 potential loss. If it loses, daily P&L hits -$4,100 — 82% of the daily limit. One more loss after that and the challenge is over. Three weeks of work, gone.
With the tracker, the picture is different. After the -$3,100, the dashboard shows:
- Daily P&L: -$3,100 (62% of $5,000 limit)
- Alert status: Yellow (crossed the 50% threshold)
The trader sees the yellow warning. They know the rules. They close the platform for the day. The account is still at $101,100 — above starting balance, challenge intact, and they trade another day.
That yellow alert saved the challenge. Not because it told the trader something they couldn’t have calculated themselves, but because it made the number impossible to ignore in the heat of the moment.
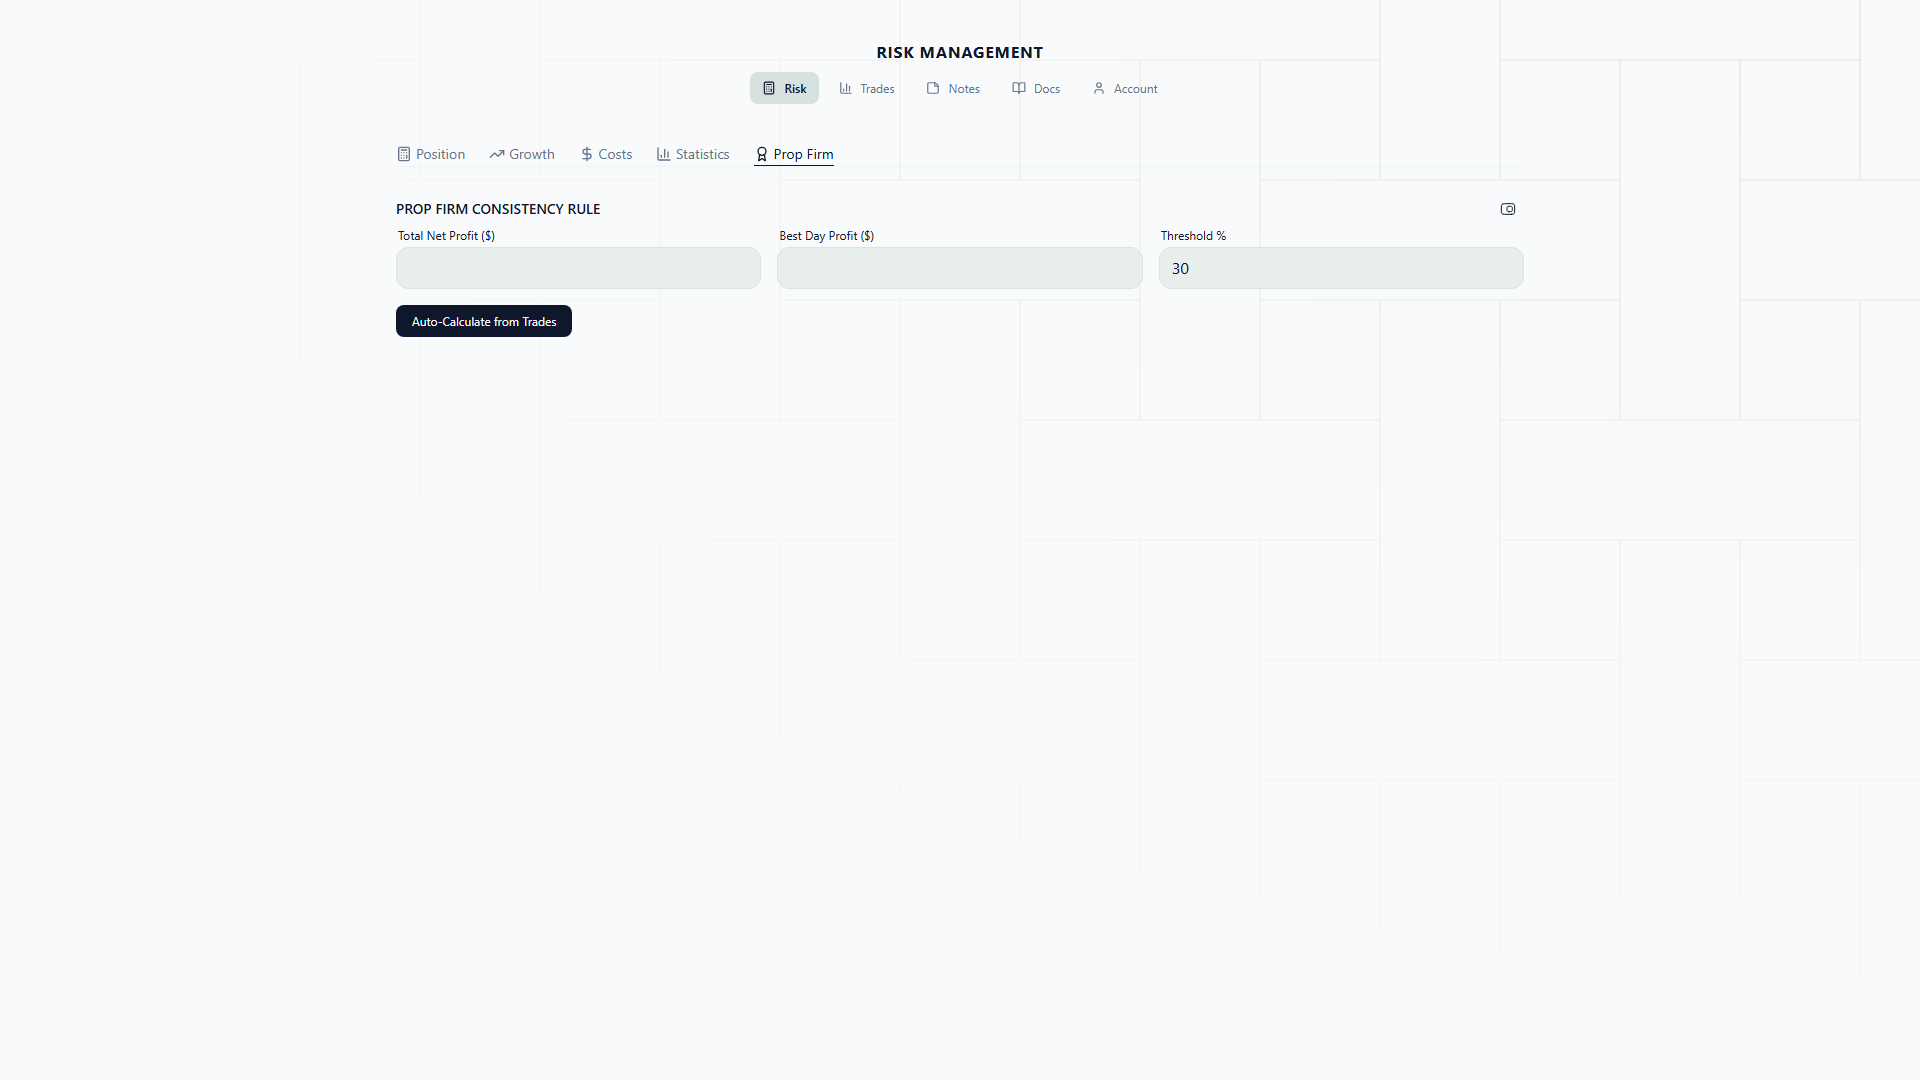
Phase Configuration
Set up your evaluation parameters:
- Starting Balance — The funded account balance
- Profit Target % — Required profit to pass the phase (e.g., 8%, 5%)
- Max Daily Loss % — Maximum loss allowed in a single day (e.g., 5%)
- Max Total Drawdown % — Maximum total drawdown allowed (e.g., 10%)
- Phase — Which phase you’re in (Phase 1, Phase 2, Funded)
- Trading Days Required — Minimum number of trading days
Dashboard
The tracker displays:
- Current Balance — Your current account balance
- P&L — Current profit/loss vs. starting balance
- Progress Bar — Visual progress toward profit target
- Daily P&L — Today’s profit/loss with limit indicator
- Drawdown Status — Current drawdown level with max threshold
Alerts
Visual warnings when approaching limits:
- Yellow — Within 50% of a limit (e.g., daily loss at 2.5% of a 5% limit)
- Red — Within 80% of a limit
Daily Limit Awareness
The alerts are not just notifications — they are behavior changers. Here is how they shift your decision-making throughout a trading day:
Green zone (0-50% of daily limit): You are trading normally. Risk your standard amount, take your setups, execute your plan. The tracker shows your daily P&L in real time, but there is no urgency. This is where you should spend most of your trading days.
Yellow zone (50-80% of daily limit): Something has gone wrong today. Maybe two trades stopped out, or a news event moved against you. The yellow alert means: be selective. Only take A+ setups. Consider reducing position size for the rest of the day. Some traders make it a rule to stop taking new trades once they hit yellow. Others reduce risk to 0.5% for remaining trades. Either way, the yellow zone demands a conscious decision about whether to continue.
Red zone (80-100% of daily limit): Stop trading. This is not a suggestion. You are one normal-sized loss away from breaching the daily limit and ending your challenge. Close any open trades if they are near entry (to limit further risk) and walk away from the screen. You can trade again tomorrow with a full daily limit reset.
The psychological power of the tracker is that it makes “stop trading” a rule tied to a visible number rather than a judgment call tied to an emotion. When you are down for the day and frustrated, your judgment is at its worst. The tracker provides an external, objective signal that overrides your in-the-moment desire to “make it back.”
Risk Sizing Integration
The prop firm tracker feeds into the position sizing calculator — it automatically adjusts max risk to prevent breaching your daily loss or total drawdown limits.
How the Integration Works
When you have a prop firm challenge configured, the position sizing tab becomes aware of your remaining daily and total limits. Here is a practical example of what that means:
Scenario: FTMO $100K, daily limit 5% ($5,000), current daily P&L: -$3,200
Remaining daily limit: $5,000 - $3,200 = $1,800
Without integration, your 1% risk position would be $1,000 — technically within the remaining $1,800 limit. But if that trade loses and you take another at $1,000, you are at -$5,200. Challenge breached.
With integration, the calculator knows you have $1,800 of daily limit left. It automatically caps your maximum risk so that no single trade can breach the remaining limit. If you set risk to 1% ($1,000), it allows it. But if you try to set risk to 2% ($2,000), the calculator reduces it to stay within the $1,800 remaining.
This does not just protect against the current trade — it also accounts for the possibility that you might take one more trade after this one. The integration is conservative by design. Its job is to make it mechanically impossible for a single trade to end your challenge.
Another scenario: Total drawdown limit approaching
You are at $91,500 on a $100,000 account. Max total drawdown is 10%, meaning $90,000 is the breach level. You have $1,500 of total drawdown room left. The calculator automatically prevents you from risking more than $1,500 on any single trade, regardless of what your risk percentage would otherwise produce.
This is the kind of protection that is hard to maintain manually. When you are under pressure and behind on a challenge, the temptation is to increase risk to catch up. The integration prevents that from becoming a terminal mistake.
How to Use the Prop Firm Tracker: Step by Step
Setting up a new challenge:
-
Enter the phase configuration from your prop firm’s rules. For FTMO: starting balance ($100,000, $50,000, etc.), profit target (8% Phase 1, 5% Phase 2), daily loss (5%), max drawdown (10%), minimum trading days (varies).
-
Set the phase (Phase 1, Phase 2, or Funded).
-
Switch to the Position Sizing tab and set your strategy to Fixed at 1% or lower. This is the recommended approach for challenges — adaptive strategies create uneven risk profiles that increase the chance of breaching daily limits on a bad day.
During the challenge:
-
Before each trading session, check the tracker dashboard. Note your progress toward the profit target and your current drawdown status. Start the day knowing exactly where you stand.
-
After each trade, update your balance. Watch the daily P&L indicator. Respect the color zones — green means go, yellow means caution, red means stop.
-
If you hit yellow, make a deliberate decision: reduce risk or stop for the day. Write down which you chose and why. This builds the discipline that carries over into the funded phase.
Between phases:
-
When you pass Phase 1, create a new configuration for Phase 2 with updated parameters (usually a lower profit target like 5%). Do not carry over Phase 1 settings — the rules are different.
-
When you reach the funded phase, you can relax the strategy slightly. Some traders switch from Fixed 1% to Adaptive Growth or Reset-on-Loss with a 1% base. The key difference is that funded accounts usually have the same drawdown rules but no profit target or time limit, so you can afford to be patient.