Statistics
Advanced statistical tools for risk analysis.
Why These Numbers Matter
You can have a profitable strategy and still blow your account. That sounds contradictory, but it is a mathematical certainty when position sizing is wrong.
A strategy with a 55% win rate and 1.5:1 average risk-reward is profitable. Over 1,000 trades, it generates a positive expectancy. But “over 1,000 trades” assumes you survive long enough to get there. If your position sizing is too large, a normal losing streak — which will happen, guaranteed — can wipe out enough of your account that recovery becomes impractical.
Risk of ruin and Kelly criterion answer two fundamental questions:
- Risk of ruin: “Given my edge and my position sizing, what is the probability I lose so much that I effectively cannot recover?”
- Kelly criterion: “Given my edge, what is the mathematically optimal amount to risk on each trade to maximize long-term growth?”
These are not theoretical exercises. They are the bridge between “my strategy is profitable on paper” and “my strategy will actually grow my account in practice.”
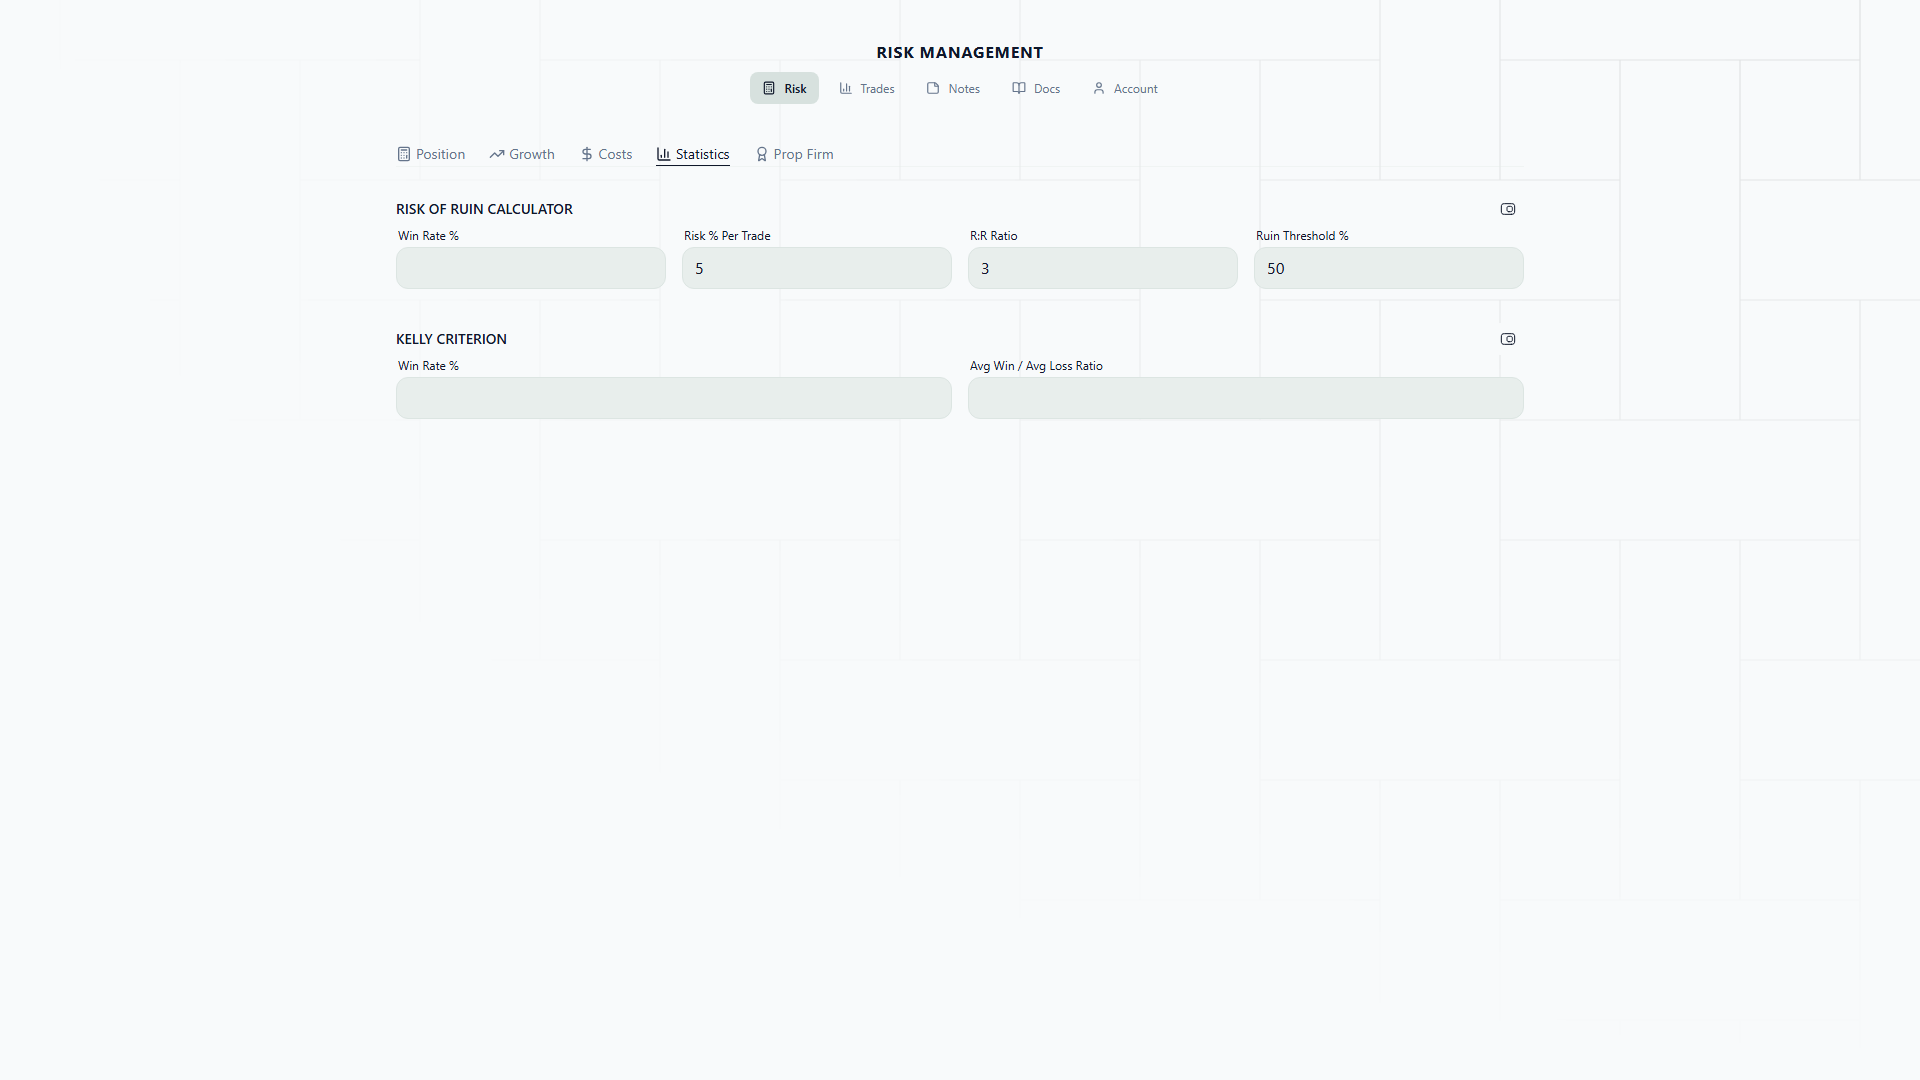
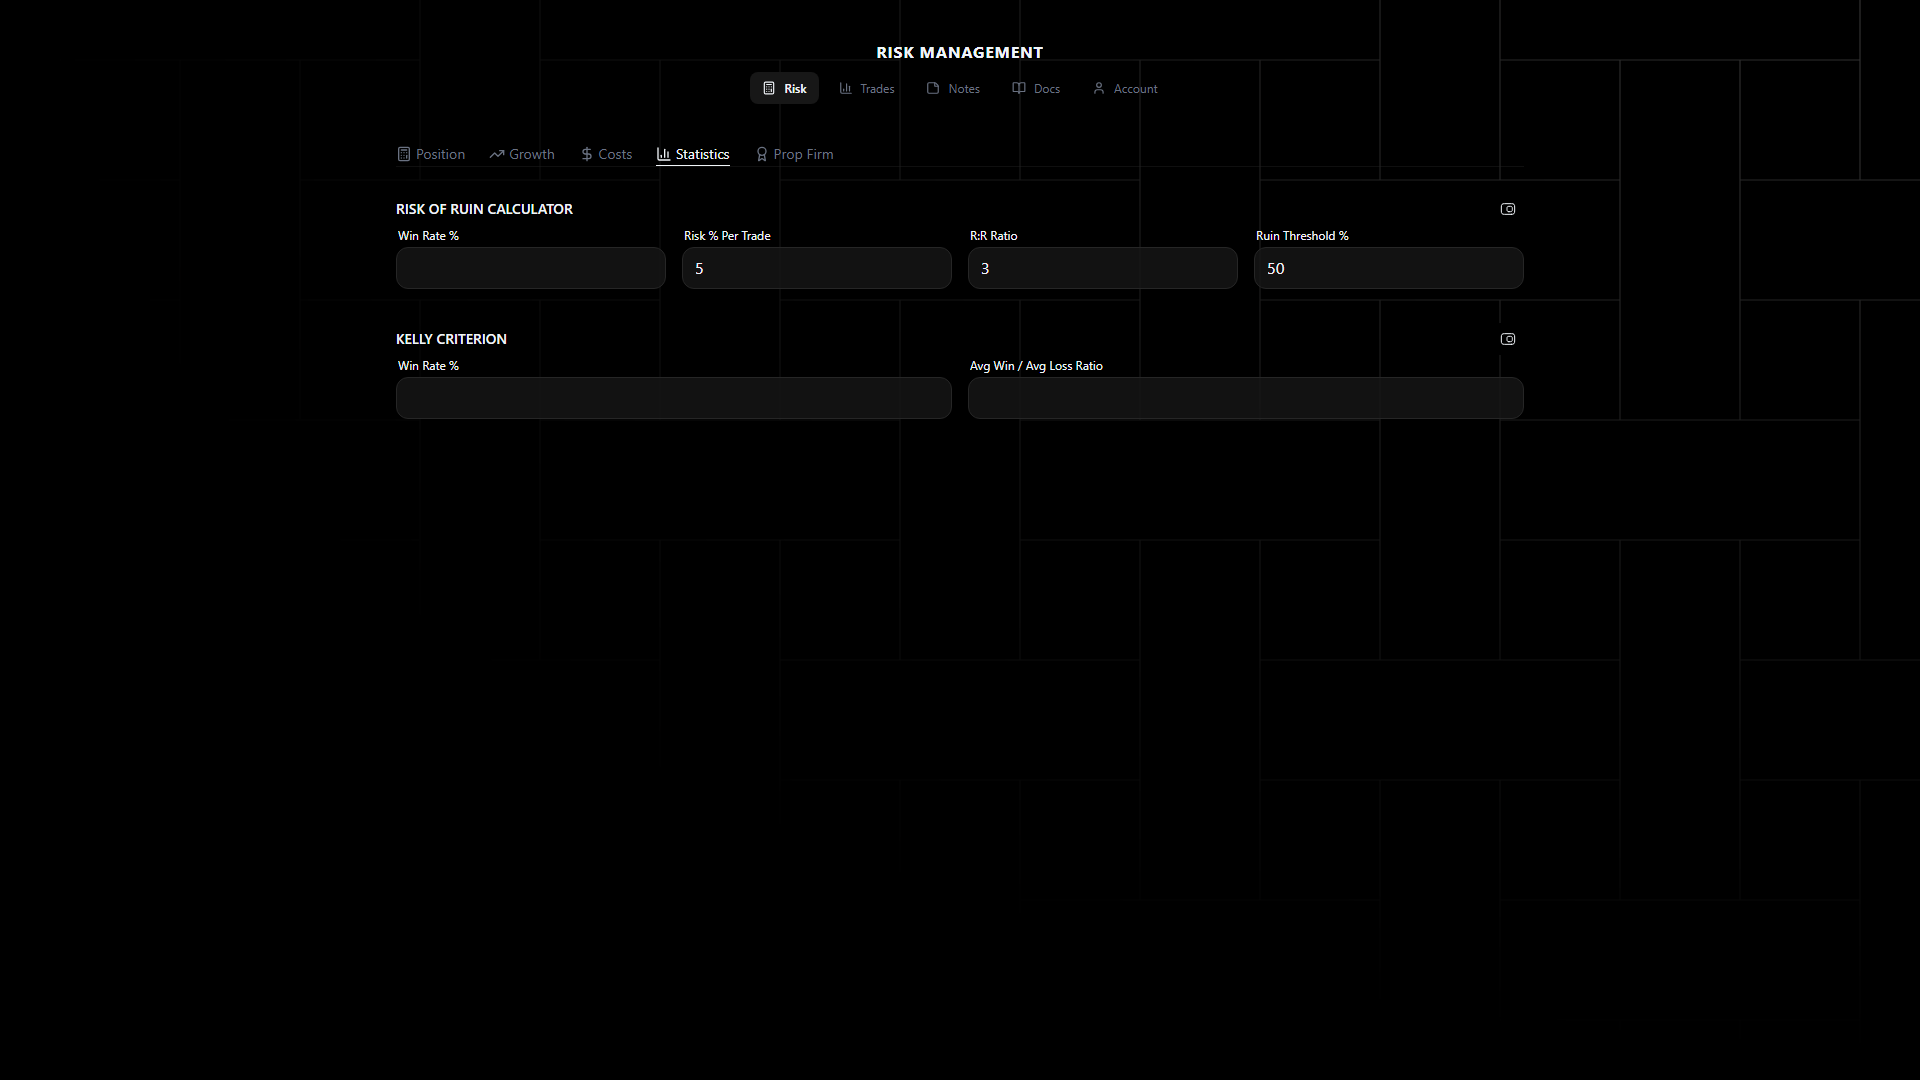
Risk of Ruin
Calculate the probability of losing a specified percentage of your account:
Inputs
- Win Rate % — Your historical win rate
- Average Win/Loss Ratio — Average winner size divided by average loser size
- Risk per Trade % — Percentage risked on each trade
- Ruin Threshold % — What percentage loss constitutes “ruin” (e.g., 50%)
Output
- Probability of Ruin — Percentage chance of hitting your ruin threshold
- Risk Assessment — Low / Medium / High / Extreme based on the probability
A risk of ruin above 1% suggests your position sizing is too aggressive for your win rate and RR ratio.
Real-Life Scenario: Same Strategy, Different Outcomes
Meet two traders using the exact same EURUSD breakout strategy:
- Win rate: 55%
- Average win/loss ratio: 1.5:1
- Ruin threshold: 50% drawdown
Trader A risks 5% per trade. Plugging these numbers into the Risk of Ruin calculator: probability of ruin is approximately 23%. That means there is roughly a 1-in-4 chance that Trader A will, at some point, lose half their account. Not because the strategy is bad — it has a clear positive expectancy — but because 5% risk per trade creates enough variance that a normal losing streak can compound into catastrophic damage.
For context, a 55% win rate means you lose 45% of the time. A streak of 8 consecutive losses has about a 1.7% chance of occurring in any given 8-trade window. But over 200 trades, the probability of experiencing at least one 8-loss streak rises to about 30%. Eight losses at 5% each: that is a 33.7% drawdown. Add a few more losses (which are likely during the recovery period when confidence is shaken) and you are approaching 50%.
Trader B risks 2% per trade. Same strategy, same numbers, different sizing. Probability of ruin drops to approximately 0.3%. Eight consecutive losses at 2% costs 15% of the account — uncomfortable but entirely survivable. The trader can continue executing the same strategy without needing to reduce lot sizes or take a break.
The strategy didn’t change. The edge didn’t change. The only difference was the number in the lot size field. That is why risk of ruin is not optional — it is the reality check that sits between a good strategy and a surviving account.
Kelly Criterion
Calculate the theoretically optimal bet size to maximize long-term growth:
Formula
Kelly % = W - (1 - W) / R
Where:
- W = Win rate (as a decimal)
- R = Average win/loss ratio
Inputs
- Win Rate % — Your historical win rate
- Average Win/Loss Ratio — Average winner / average loser
Output
- Full Kelly % — The theoretical optimal risk percentage
- Half Kelly % — A more conservative approach (commonly recommended)
- Quarter Kelly % — Ultra-conservative Kelly fraction
Most traders use half Kelly or less to reduce variance while still capturing most of the growth benefit.
The Half-Kelly Recommendation
Full Kelly is the mathematically optimal bet size — in theory. In practice, it is almost always too aggressive for trading. Here is why:
Full Kelly assumes perfect knowledge of your edge. Your win rate of 55% is an estimate based on past data. It could be 52% or 58% in reality. It will drift over time as market conditions change. Full Kelly is optimal only if your inputs are exact, which they never are.
Full Kelly assumes no execution friction. Slippage, spread widening during news, partial fills, and emotional execution errors all reduce your real-world edge below the number you measured. Full Kelly does not account for any of this.
Full Kelly maximizes growth but also maximizes drawdowns. The variance is extreme. A full Kelly portfolio can experience 50%+ drawdowns as part of normal operation. Mathematically, it recovers and still grows optimally over infinite time. Psychologically, almost no trader can sit through a 50% drawdown without changing their behavior — and that behavioral change (reducing size at the bottom, increasing at the top) destroys the mathematical advantage.
Half Kelly captures approximately 75% of the growth rate with dramatically less variance. The drawdowns are roughly half as deep. The equity curve is much smoother. And because your inputs are estimates rather than known values, half Kelly provides a buffer against estimation error.
Quarter Kelly is for traders who prioritize capital preservation above all else. It captures roughly 50% of the optimal growth rate but with minimal drawdowns. This is appropriate for prop firm accounts, accounts near their maximum drawdown tolerance, or traders who are still building confidence in their edge.
Example with numbers:
- Win rate: 55% (W = 0.55)
- Average win/loss ratio: 1.5:1 (R = 1.5)
- Full Kelly:
0.55 - (0.45 / 1.5)= 0.55 - 0.30 = 25% - Half Kelly: 12.5%
- Quarter Kelly: 6.25%
Full Kelly at 25% per trade is wildly aggressive — most traders would never be comfortable with that level of variance. Half Kelly at 12.5% is still very aggressive. In practice, most disciplined traders end up risking 1-3% per trade, which corresponds to roughly 1/10th to 1/5th Kelly for a strategy with these characteristics.
The Kelly calculation is useful not as a target but as a ceiling. If your chosen risk percentage is above full Kelly, you are definitively over-sizing — you are actually reducing your long-term growth rate by risking too much. If you are below half Kelly, you are in a comfortable zone. The exact percentage within that range comes down to your personal risk tolerance and the confidence you have in your edge estimate.
How to Use This Tab: Step by Step
Here is a practical workflow for getting actionable numbers from the Statistics tab:
Step 1: Gather your actual trading data.
You need your win rate and average win/loss ratio. If you are logging trades with the Trade Journal, pull these numbers from the Analytics tab. If not, go through your broker’s trade history and calculate them manually. You need at least 30 trades for these numbers to be meaningful — fewer than that and you are working with statistical noise.
Step 2: Enter your numbers into Risk of Ruin.
Set your win rate, average RR, your current risk per trade percentage, and a ruin threshold (50% is standard). Look at the probability. If it is above 1%, your position sizing is too aggressive for your current edge. This is not a suggestion — it is a mathematical statement.
Step 3: Adjust risk per trade until ruin probability drops below 1%.
Try 2%, then 1.5%, then 1%. Find the highest risk percentage that keeps ruin below 1%. That is your maximum safe risk level. You can always risk less, but risking more means accepting a non-trivial probability of catastrophic loss.
Step 4: Cross-reference with Kelly.
Enter your win rate and RR into the Kelly calculator. Your safe risk level from Step 3 should be at or below half Kelly. If it is above half Kelly, the risk of ruin calculator is already telling you to reduce it, so Kelly confirms the constraint. If it is well below quarter Kelly, you have room to increase risk if you want faster growth — but only if risk of ruin stays below 1%.
Step 5: Re-check monthly.
Your win rate and average RR change over time. Market conditions shift. A strategy that had a 58% win rate in a trending market might drop to 50% in a ranging market. Re-running these calculations monthly keeps your position sizing aligned with your actual performance, not a stale snapshot from three months ago.